What is ICT Trading?
ICT (Inner Circle Trader) is a comprehensive trading methodology developed by Michael J. Huddleston that focuses on understanding institutional order flow and market maker behavior.
Unlike traditional technical analysis, ICT teaches traders to think like institutional traders (banks, hedge funds, market makers) and identify where these large players are likely to enter and exit positions. The methodology combines price action, time-based analysis, and institutional order flow concepts.
Key ICT Principles
- Institutional Order Flow: Understanding how banks and market makers accumulate and distribute positions
- Time-Based Trading: Specific times when institutional activity is highest (killzones)
- Liquidity Concepts: Identifying where stop losses cluster and how institutions sweep liquidity
- High-Probability Setups: Trading only during optimal times with clear institutional interest
Market Maker Model
The Market Maker Model is the foundation of ICT trading. It describes how institutional players manipulate price to create liquidity before making their true directional move.
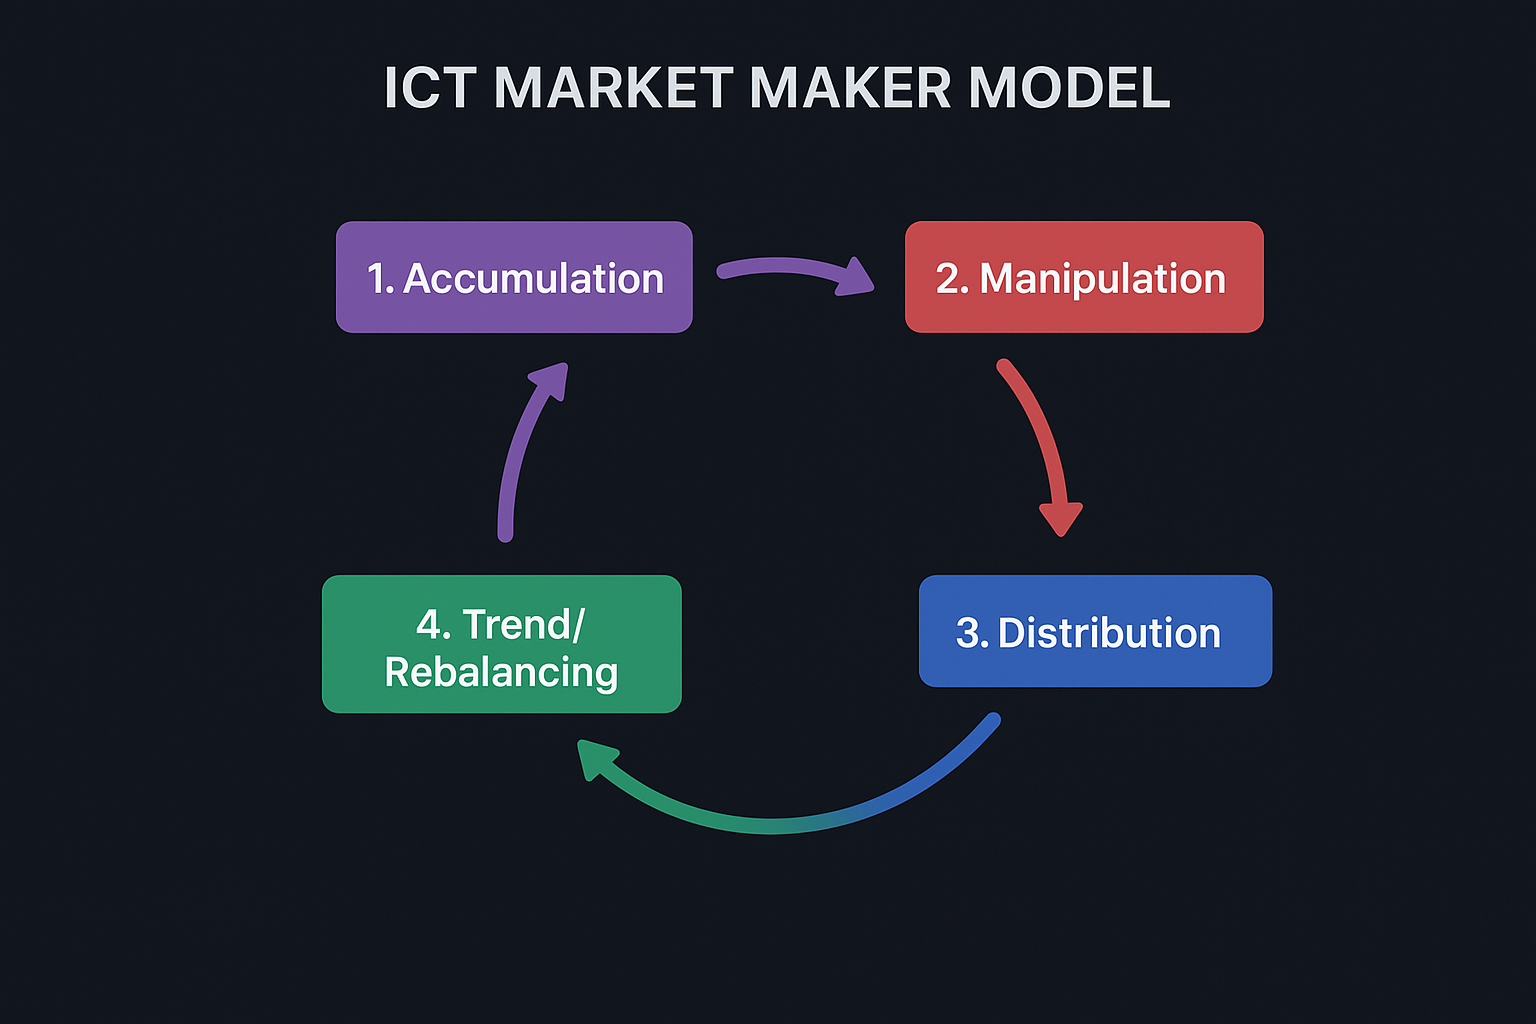
1. Accumulation
Market makers accumulate positions at favorable prices, often during consolidation or liquidity sweeps.
2. Manipulation
False moves to sweep liquidity (stop losses) and trap retail traders before the true move begins.
3. Distribution
The true directional move where institutions distribute their positions to retail traders.
Order Blocks
Order blocks are zones where institutional orders are placed. They represent the last bearish candle before a bullish move (bullish order block) or the last bullish candle before a bearish move (bearish order block).
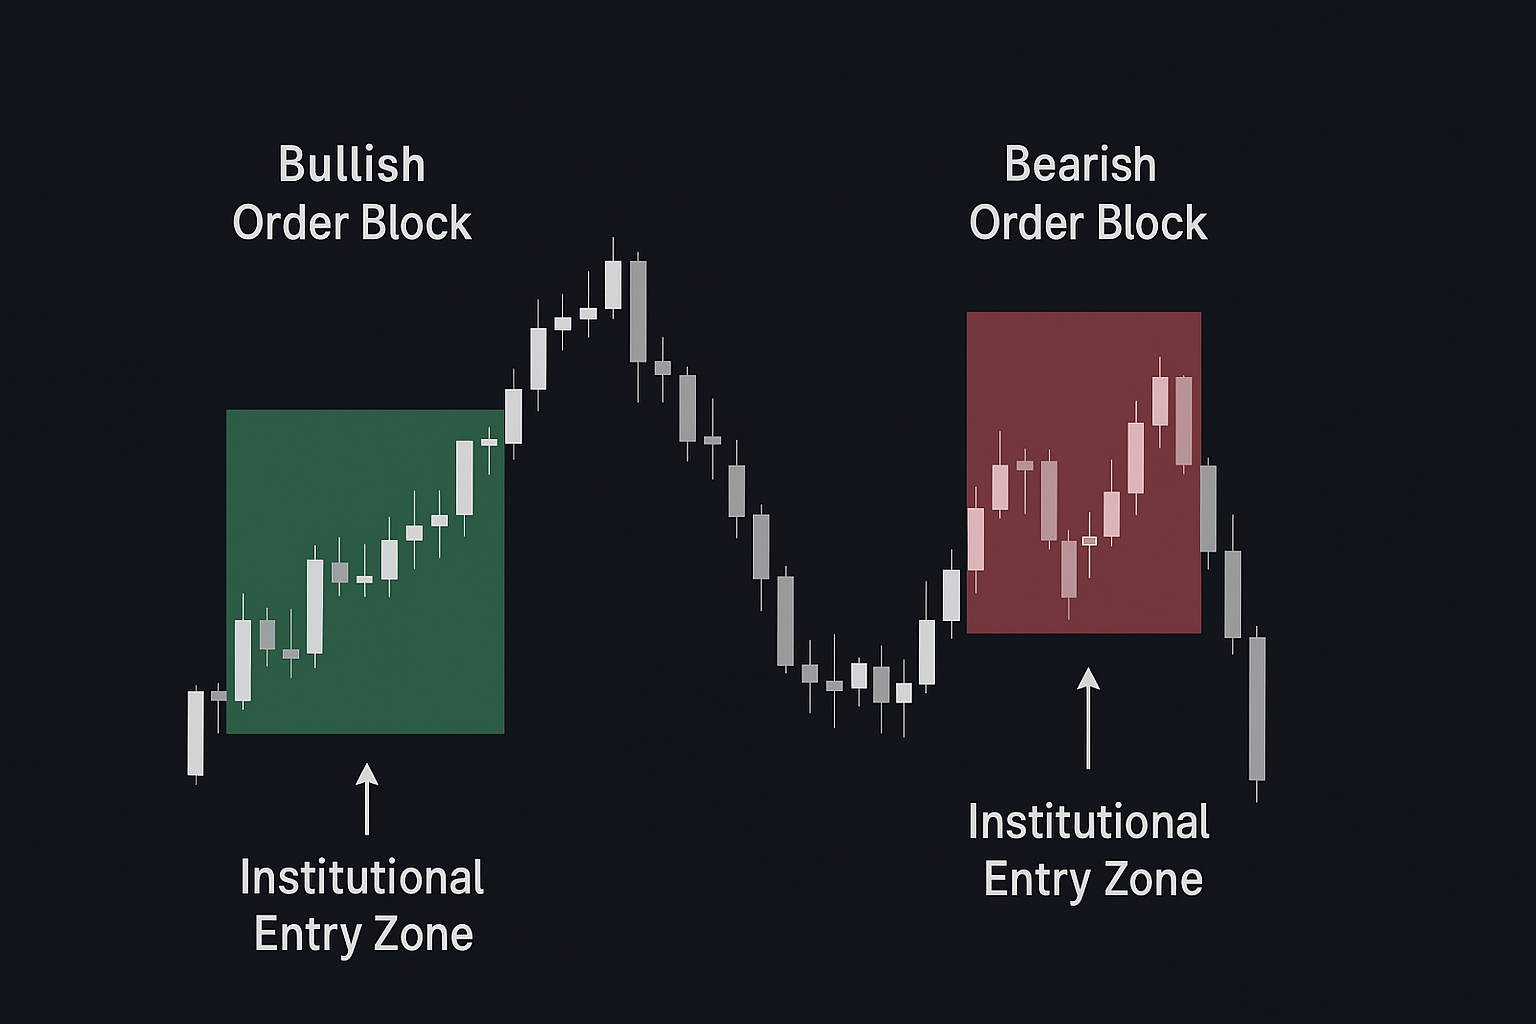
Identifying Valid Order Blocks
Bullish Order Block
- • Last down candle before a strong bullish impulse
- • Institutions placed buy orders in this zone
- • Price often returns to test this level
- • High probability of bounce when retested
Bearish Order Block
- • Last up candle before a strong bearish impulse
- • Institutions placed sell orders in this zone
- • Price often returns to test this level
- • High probability of rejection when retested
Fair Value Gaps (FVG)
Fair Value Gaps are imbalances in price where one candle's body doesn't overlap with the candle two periods away. These gaps represent inefficiencies that price often returns to fill.
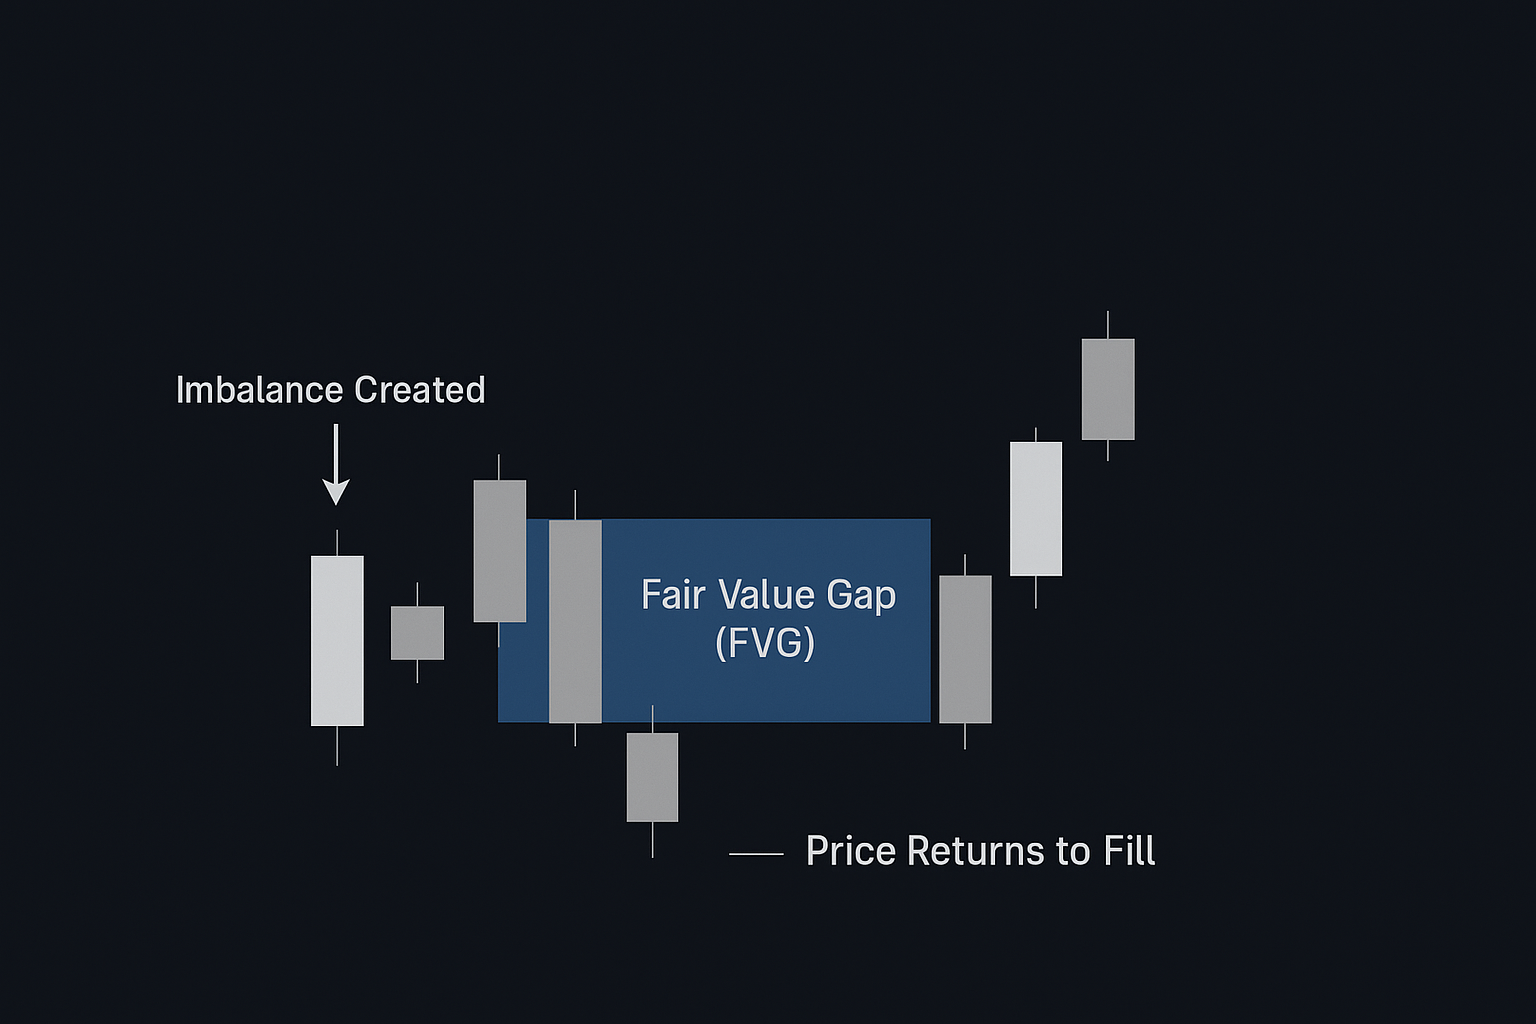
FVG Trading Rules
- • FVGs act as magnetic zones that price tends to revisit
- • A gap between candle 1 high and candle 3 low (bullish FVG)
- • A gap between candle 1 low and candle 3 high (bearish FVG)
- • Best used in conjunction with order blocks and killzones
- • 50% retracement of FVG is often the optimal entry
Breaker Blocks
A breaker block is a failed order block that gets broken through. Once broken, it changes polarity and becomes a support/resistance zone from the opposite side.
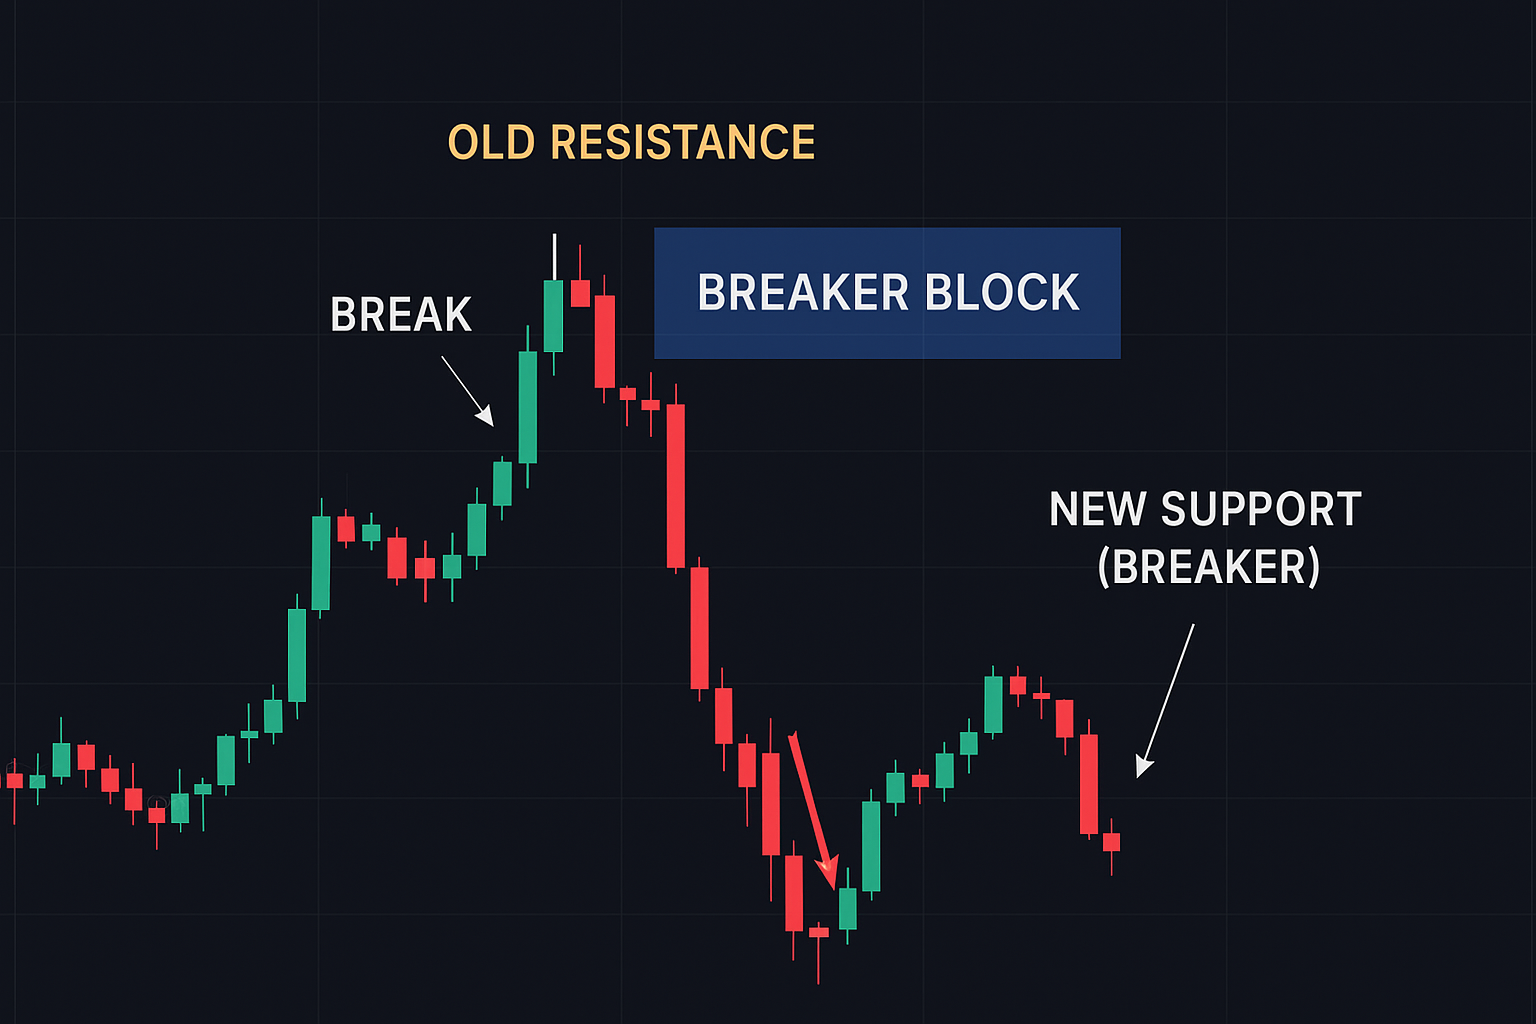
Bullish Breaker: A bearish order block that gets broken to the upside becomes a bullish breaker, now acting as support.
Bearish Breaker: A bullish order block that gets broken to the downside becomes a bearish breaker, now acting as resistance.
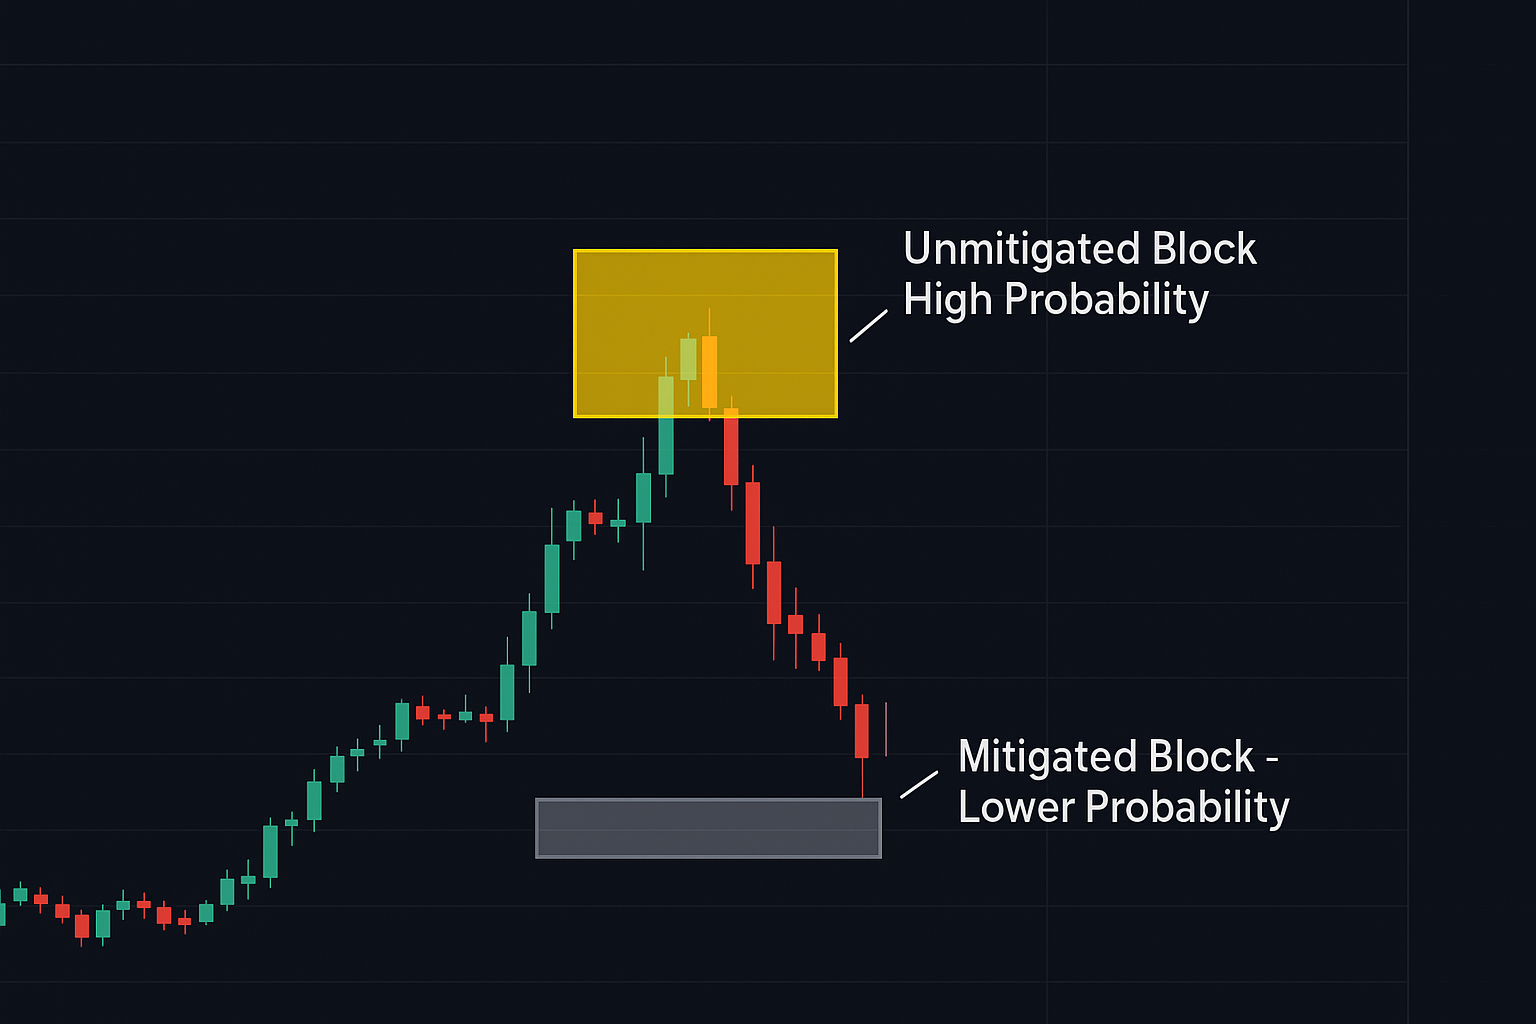
Mitigation Blocks
Mitigation blocks are institutional order blocks that have been partially filled but not completely penetrated. They represent areas where institutions are still actively managing positions.
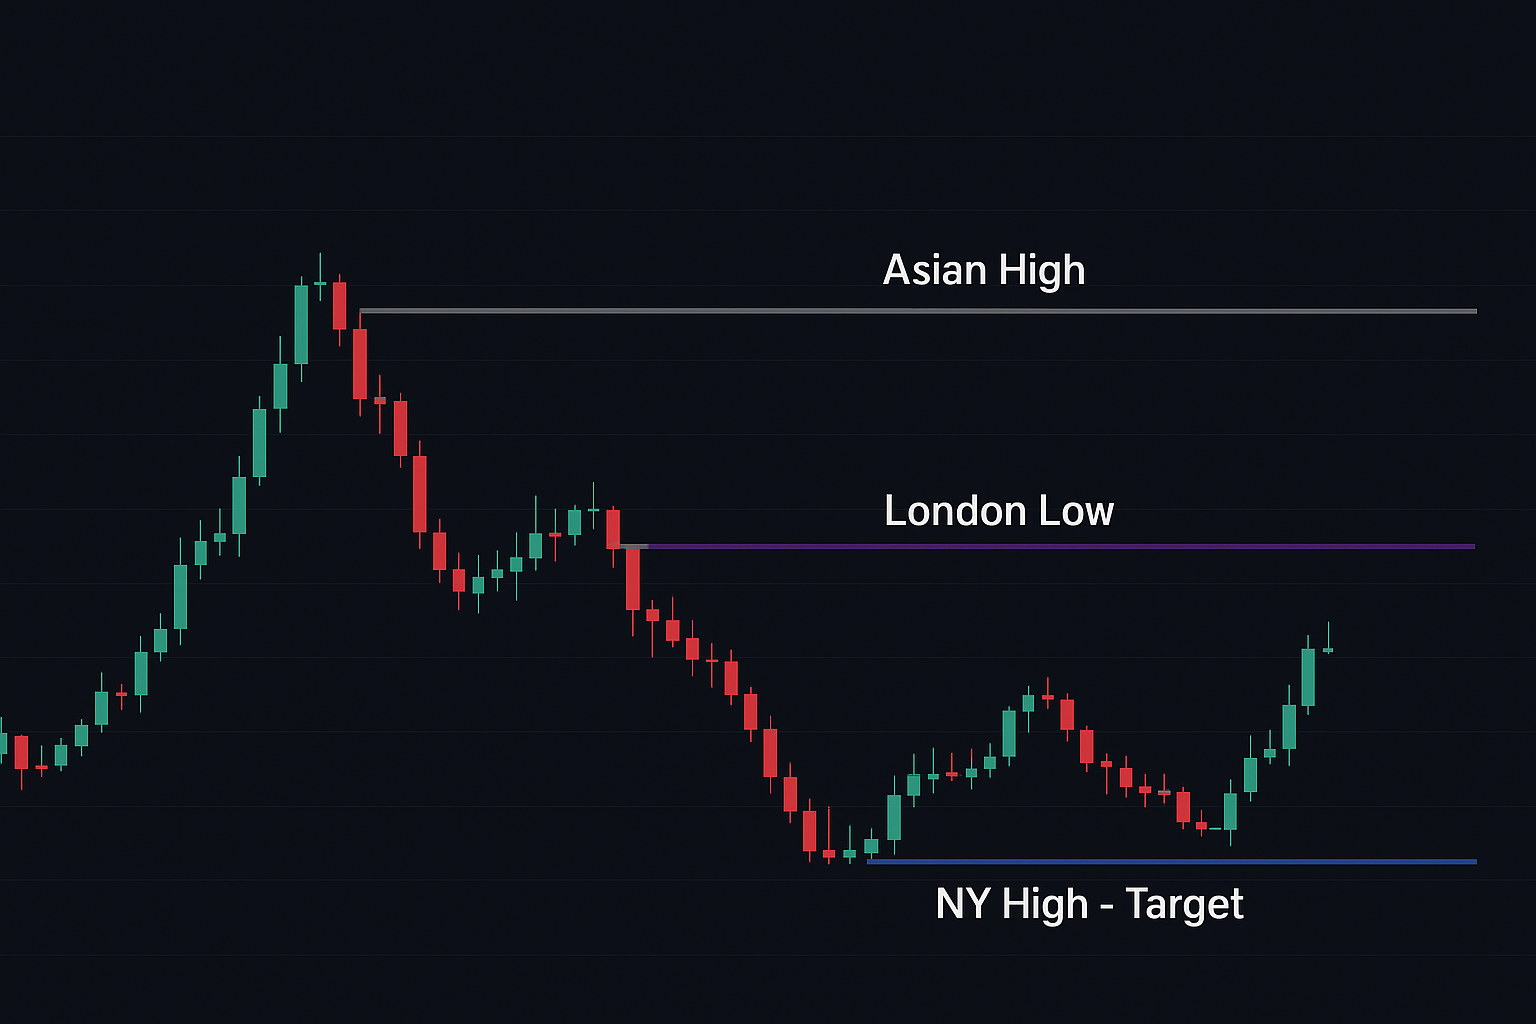
Liquidity Pools & Sweeps
Liquidity pools are areas where many stop losses are clustered, typically above swing highs (buy stops) and below swing lows (sell stops). Institutions sweep these pools before making true directional moves.
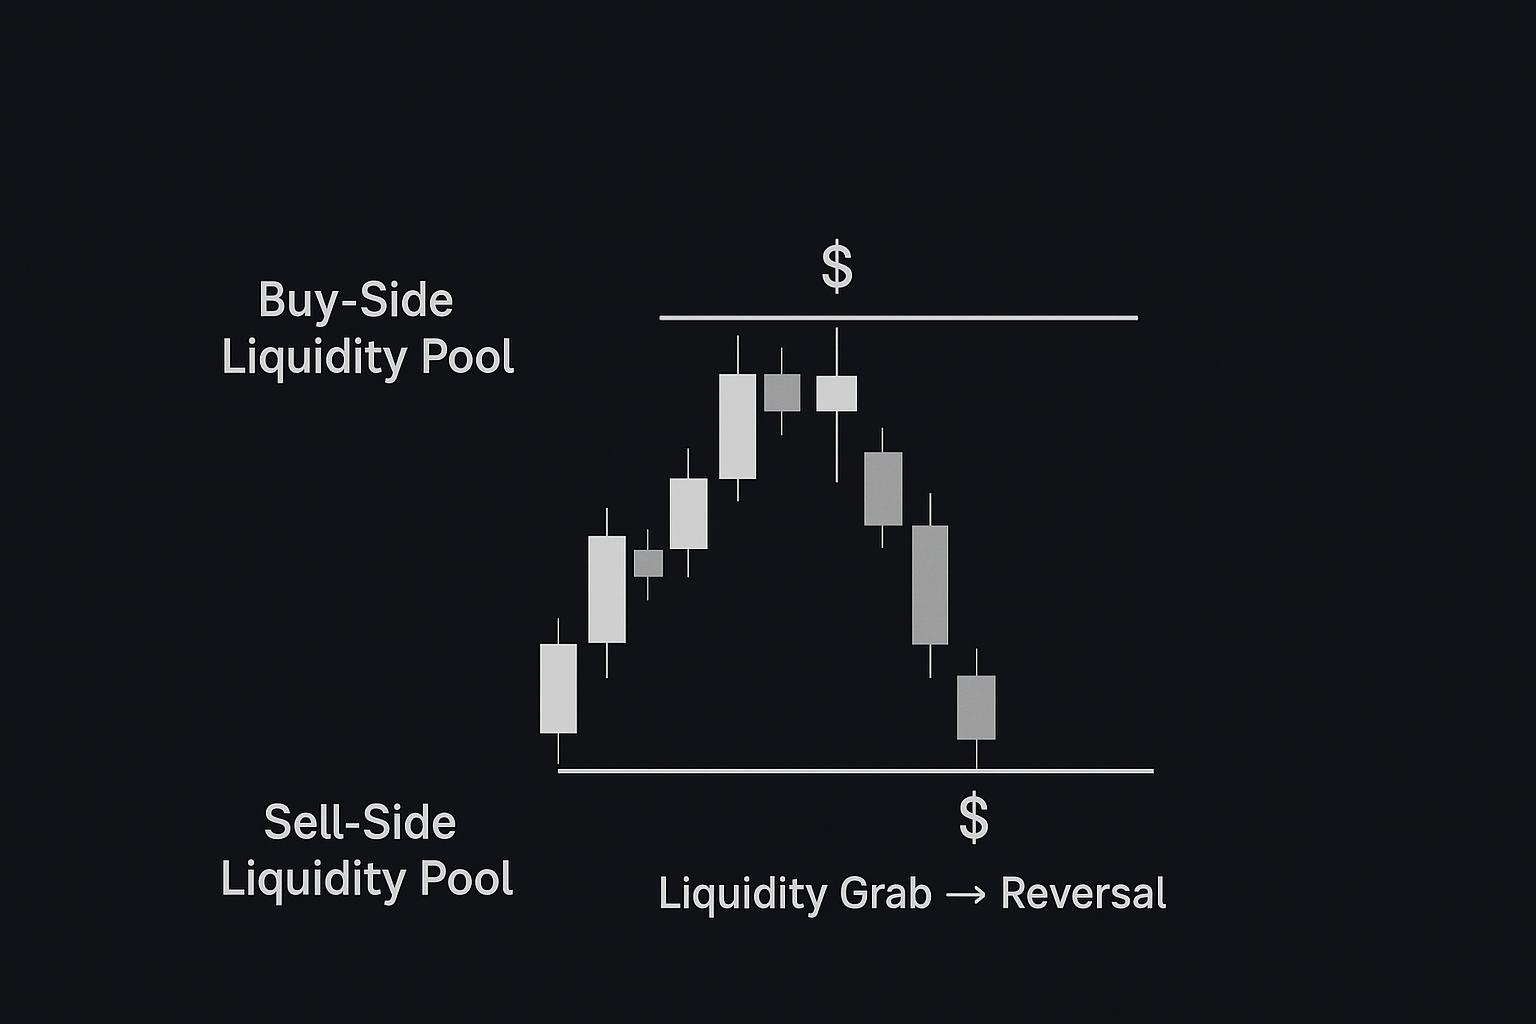
Buy Side Liquidity
- • Located above swing highs
- • Buy stop losses cluster here
- • Market makers sweep up to collect stops
- • Often leads to reversal down
Sell Side Liquidity
- • Located below swing lows
- • Sell stop losses cluster here
- • Market makers sweep down to collect stops
- • Often leads to reversal up
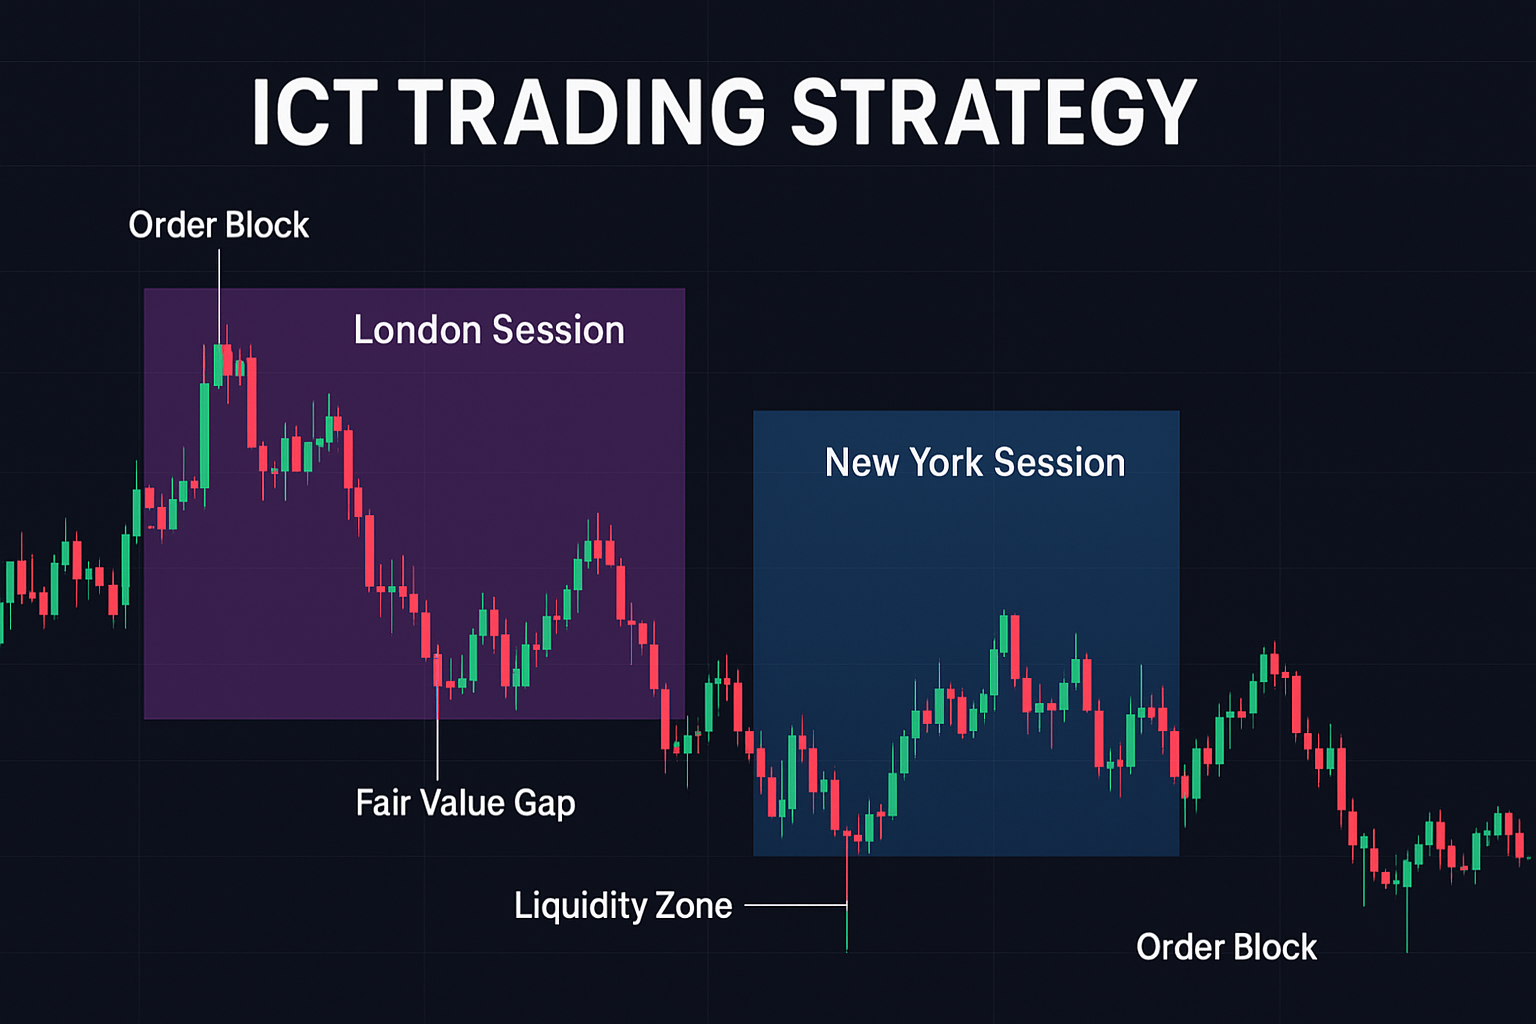
ICT Killzones & Trading Sessions
Killzones are specific time windows when institutional activity is at its highest. Trading during these periods significantly increases probability of success.
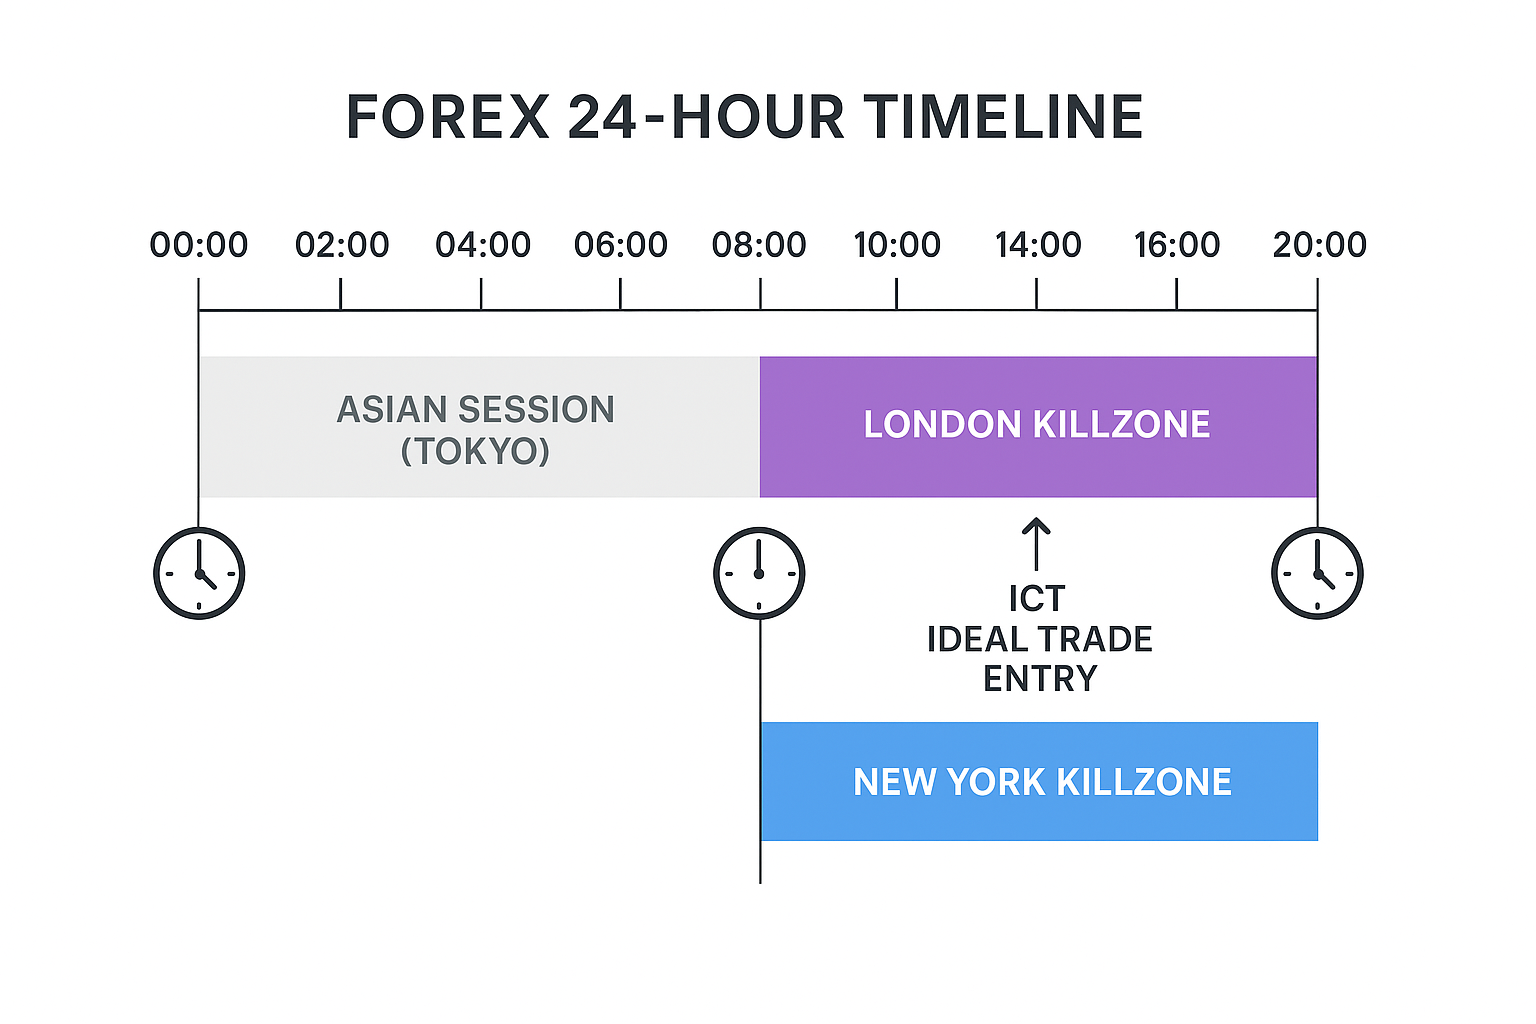
London Killzone
2:00 - 5:00 AM EST
First major move of the day. High volatility and strong directional moves.
New York AM
7:00 - 10:00 AM EST
Most important session. Maximum institutional participation and volume.
New York PM
1:00 - 4:00 PM EST
Afternoon session. Often continues morning's direction or reverses.
Optimal Trade Entry (OTE)
Optimal Trade Entry is a Fibonacci-based entry method where you wait for price to retrace to the 0.62-0.79 range before entering a trade in the direction of the trend.
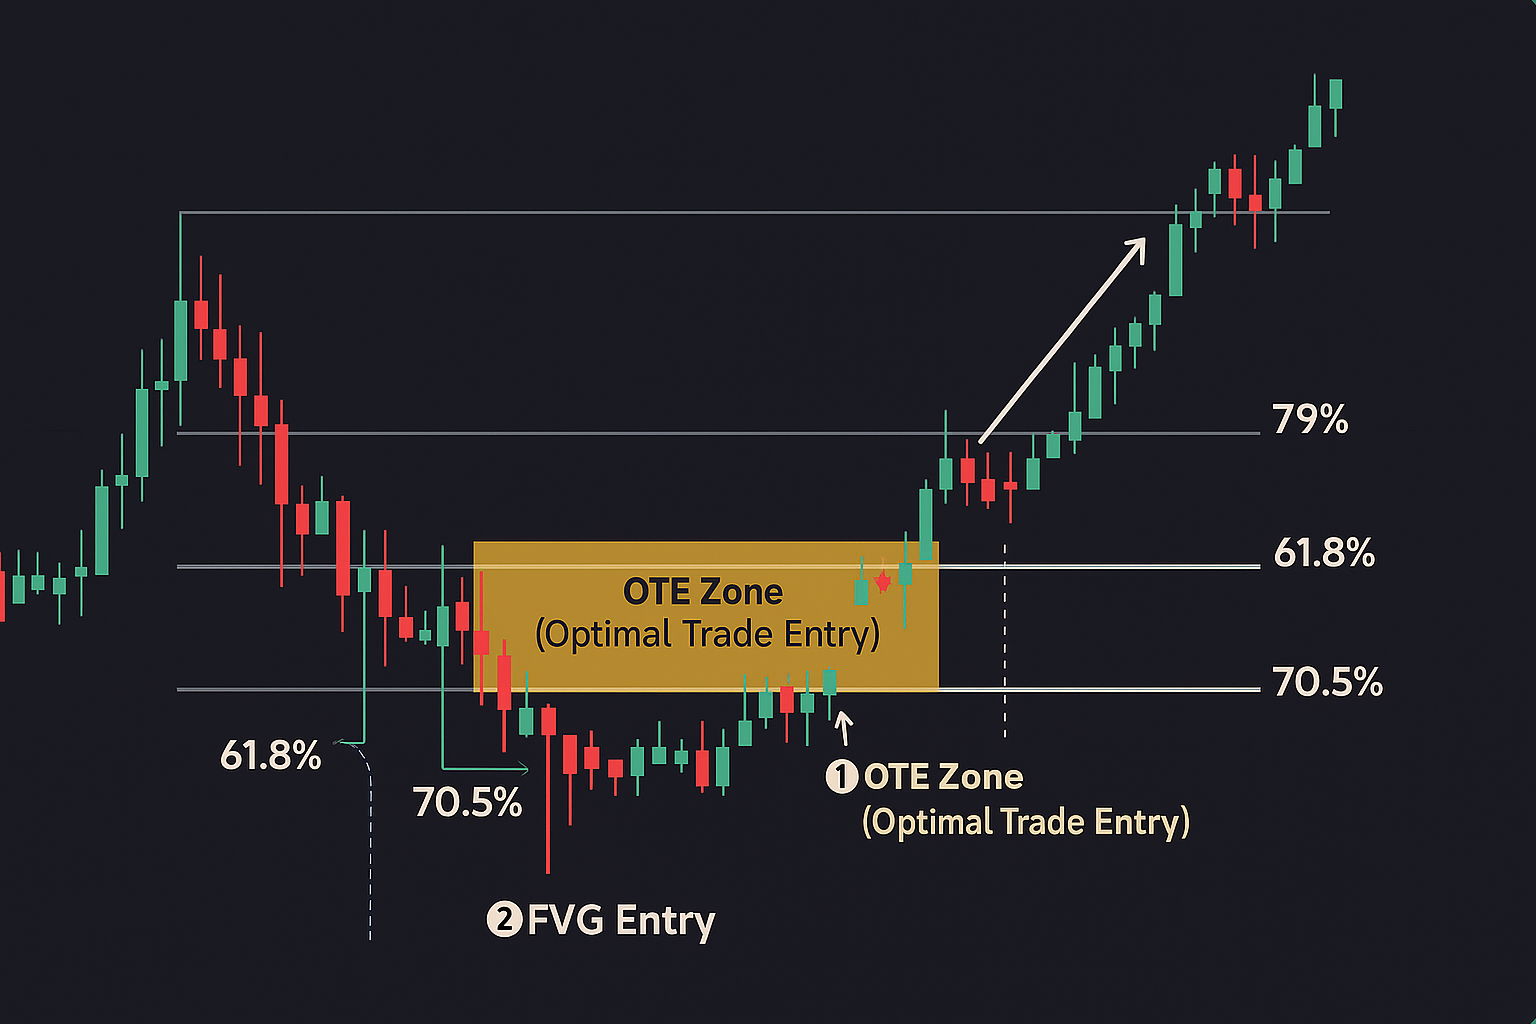
OTE Entry Rules
- 1Identify clear market structure - higher highs/lows (bullish) or lower highs/lows (bearish)
- 2Wait for impulse move in trend direction
- 3Draw Fibonacci from swing low to swing high (or vice versa)
- 4Enter between 0.62-0.79 retracement during killzone
- 5Place stop loss beyond 0.79 or recent swing point
Power of Three
Power of Three is ICT's concept that describes how market moves in three distinct phases throughout the trading day: Accumulation, Manipulation, and Distribution.
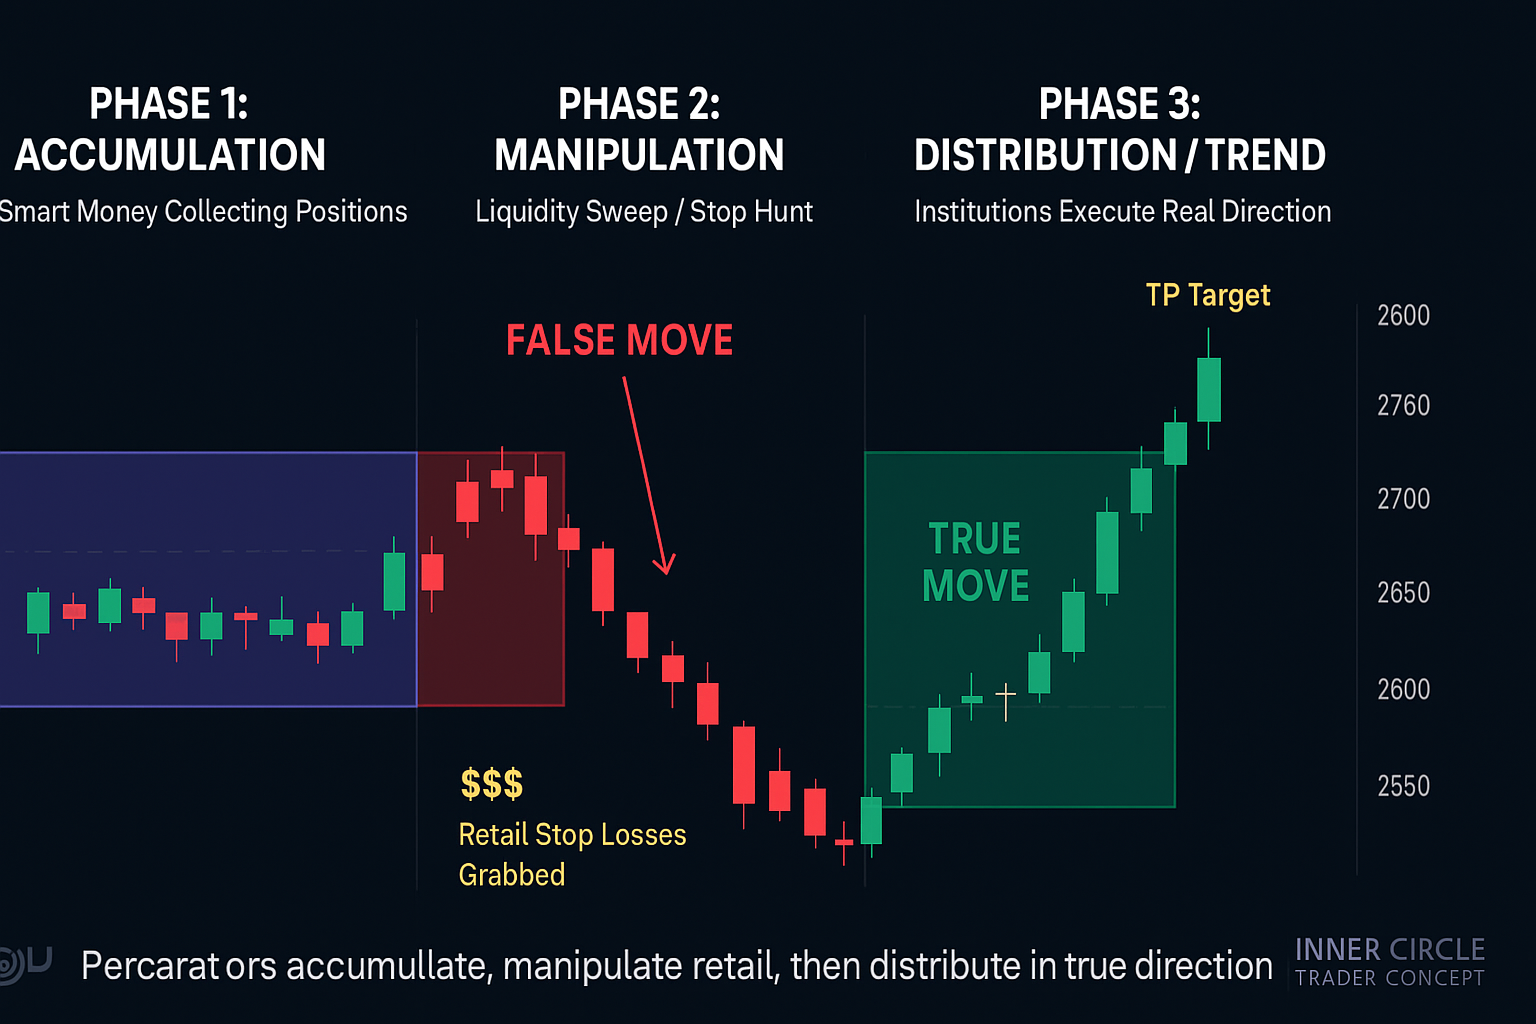
Phase 1: Accumulation (Asian Session)
Price consolidates as institutions build positions. Low volatility range. Sets up the daily range.
Phase 2: Manipulation (London Open)
False breakouts to sweep liquidity. Stop hunts above/below Asian range. Traps retail traders.
Phase 3: Distribution (New York Session)
True directional move. Institutions distribute positions to retail. Largest moves of the day.
Silver Bullet Strategy
The Silver Bullet is ICT's signature high-probability setup that occurs during specific time windows. It combines multiple ICT concepts for precise entries.
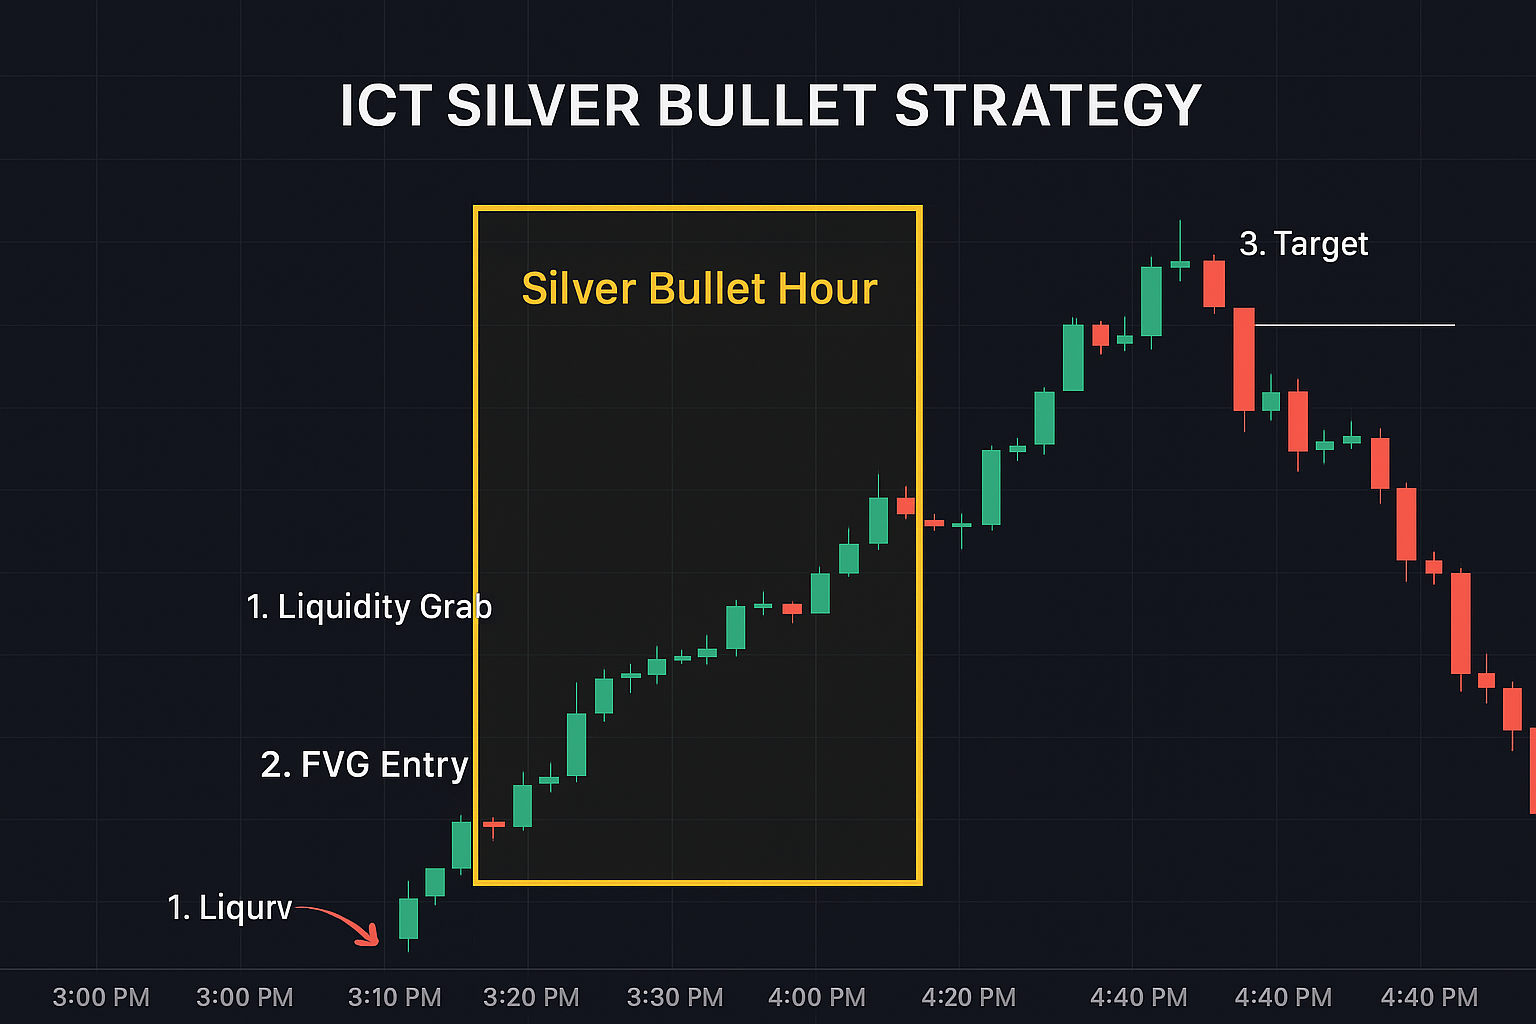
Silver Bullet Setup Requirements
- Time: 10:00-11:00 AM EST or 3:00-4:00 PM EST
- Context: Clear daily bias and market structure
- Liquidity: Recent liquidity sweep (manipulation)
- Entry: Fair value gap or order block retest
- Target: Opposite liquidity pool or key level
Complete ICT Trading Strategy
Here's how to combine all ICT concepts into a complete, high-probability trading strategy:
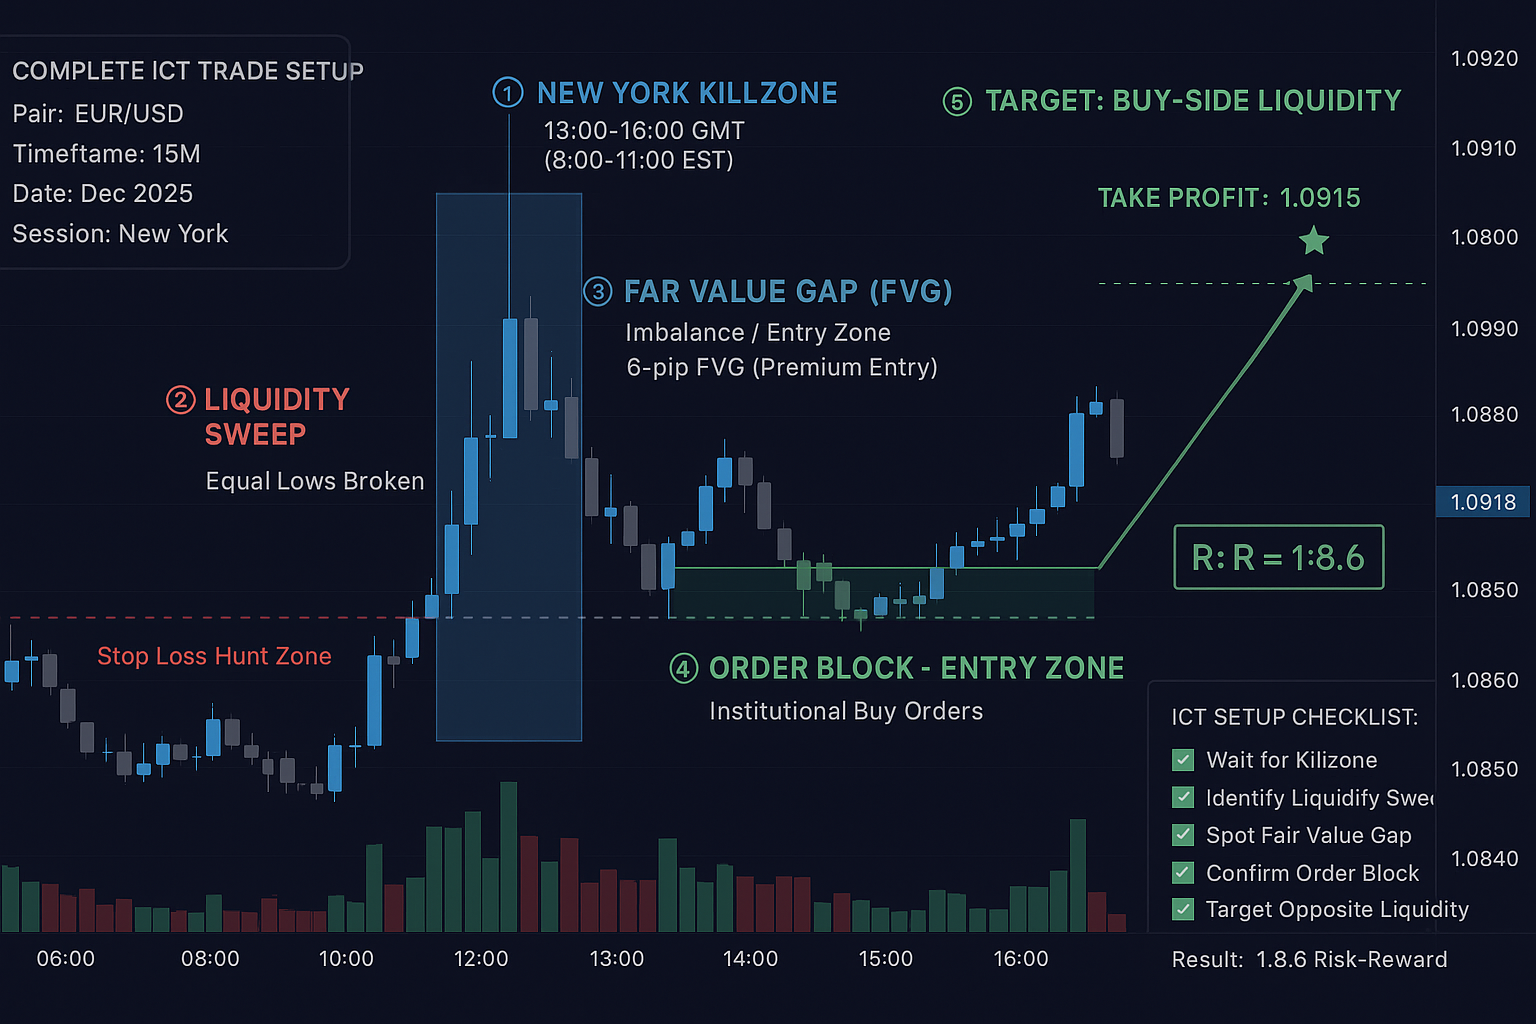
Step-by-Step ICT Trade Plan
1. Pre-Market Analysis (Before 9:30 AM EST)
- • Identify daily bias from higher timeframe (Daily/4H)
- • Mark key liquidity pools (swing highs/lows)
- • Note order blocks and fair value gaps
- • Determine Asian session range
2. London Open (2:00-5:00 AM EST)
- • Watch for liquidity sweep (manipulation)
- • Identify which side of range was swept
- • Expect reversal to opposite direction
- • Mark new order blocks formed
3. New York Killzone (7:00-10:00 AM EST)
- • Wait for retracement to order block or FVG
- • Look for OTE entry (0.62-0.79 Fib)
- • Enter during killzone with confirmation
- • Place stop beyond 0.79 or last swing
4. Trade Management
- • First target: Recent high/low
- • Second target: Opposite liquidity pool
- • Move stop to breakeven at first target
- • Trail stop or use time stops

Risk Management in ICT Trading
Proper risk management is crucial for long-term success with ICT strategies. Here are the essential rules:
Position Sizing
- • Risk 1-2% per trade maximum
- • Adjust lot size based on stop distance
- • Never risk more during revenge trading
- • Scale into positions during high confidence setups
Stop Loss Placement
- • Beyond 0.79 Fib level for OTE
- • Below/above order block structure
- • Account for spread and slippage
- • Never move stop against position
Take Profit Strategy
- • Partial profits at liquidity pools
- • Trail remaining position
- • Minimum 1:2 risk-reward ratio
- • Let winners run during strong trends
Daily Limits
- • Maximum 2-3 trades per day
- • Stop trading after 2 consecutive losses
- • Daily loss limit: 6% of account
- • Weekly review of performance
Common ICT Trading Mistakes
Avoid these common pitfalls when implementing ICT strategies:
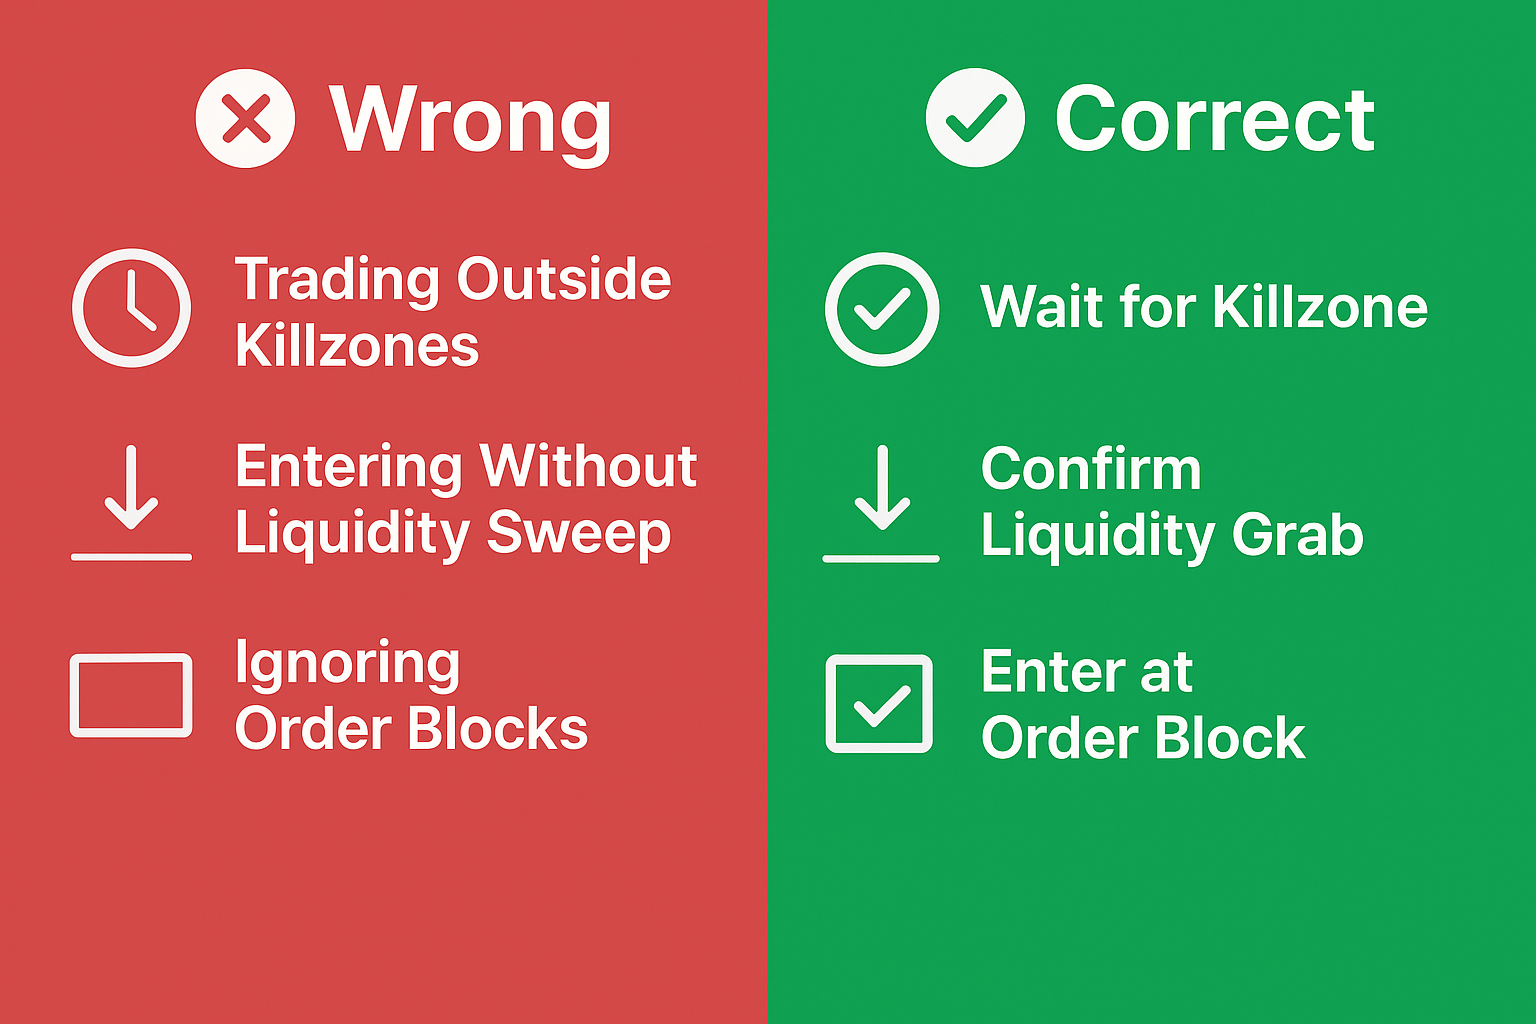
Trading Outside Killzones
Trading during low-probability times dramatically reduces success rate. Stick to London and New York sessions only.
Ignoring Higher Timeframe Bias
Taking counter-trend trades against daily bias. Always trade with higher timeframe direction.
Chasing Price Without Confirmation
Entering too early without proper retracement to OTE or order block. Patience is key.
Over-Leveraging Positions
Using too much leverage because of high confidence. Stick to 1-2% risk per trade always.
Not Journaling Trades
Failing to document setups and learn from wins/losses. Keep detailed trading journal.
Getting Started with ICT Trading
ICT trading is a comprehensive methodology that requires dedication and practice. Start with these steps:
Your ICT Learning Path
- 1
Master Market Structure
Spend 2-4 weeks identifying higher highs, higher lows, and trend changes on charts
- 2
Study Institutional Order Flow
Learn to identify liquidity sweeps, order blocks, and fair value gaps in hindsight
- 3
Practice on Demo Account
Trade only during killzones with proper risk management for 3+ months
- 4
Focus on One Setup
Master Silver Bullet or OTE setup before expanding to other strategies
- 5
Journal Everything
Document every trade with screenshots, reasoning, and emotional state
Key Takeaways
- ICT trading focuses on institutional order flow and market maker behavior
- Trade only during killzones (London, New York AM/PM) for best results
- Look for liquidity sweeps followed by reversals to key levels
- Use order blocks and fair value gaps for precise entries
- Optimal Trade Entry (OTE) at 0.62-0.79 Fib provides best risk-reward
- Master one setup (Silver Bullet recommended) before expanding
- Risk management: 1-2% per trade, max 2-3 trades per day
- Practice extensively on demo before risking real capital