Supply and Demand Trading Strategy: Complete Guide
Master the most powerful price action strategy used by institutional traders. Learn to identify high-quality supply and demand zones for consistent profits.
What is Supply and Demand Trading?
Supply and Demand trading is a pure price action methodology that identifies specific zones where institutional traders have placed large orders. Unlike traditional support and resistance, supply and demand zones represent areas where significant imbalances between buyers and sellers occurred, causing explosive price movements.
💡 The Core Principle:
When institutions place massive buy or sell orders, they cannot fill them all at once without moving the market against themselves. They leave unfilled orders in specific zones. When price returns to these zones, those orders get filled, creating predictable reactions that we can trade.
This strategy was popularized by Sam Seiden and has become one of the most reliable trading methodologies in 2025. The beauty of supply and demand is its simplicity—you are trading where the big money is positioned, giving you a significant edge over retail traders using outdated support and resistance concepts.
Why Supply and Demand Works
Institutional Orders
Banks and hedge funds leave unfilled limit orders in these zones. When price returns, their orders activate automatically, creating powerful reactions.
Predictable Reactions
Fresh zones have extremely high probability of causing reversals because institutional orders are still waiting to be filled.
Understanding Supply & Demand Concept
Supply and demand zones are fundamentally different from support and resistance levels. While support/resistance are based on historical price bounces, supply/demand zones represent actual order flow imbalances created by institutional trading activity.
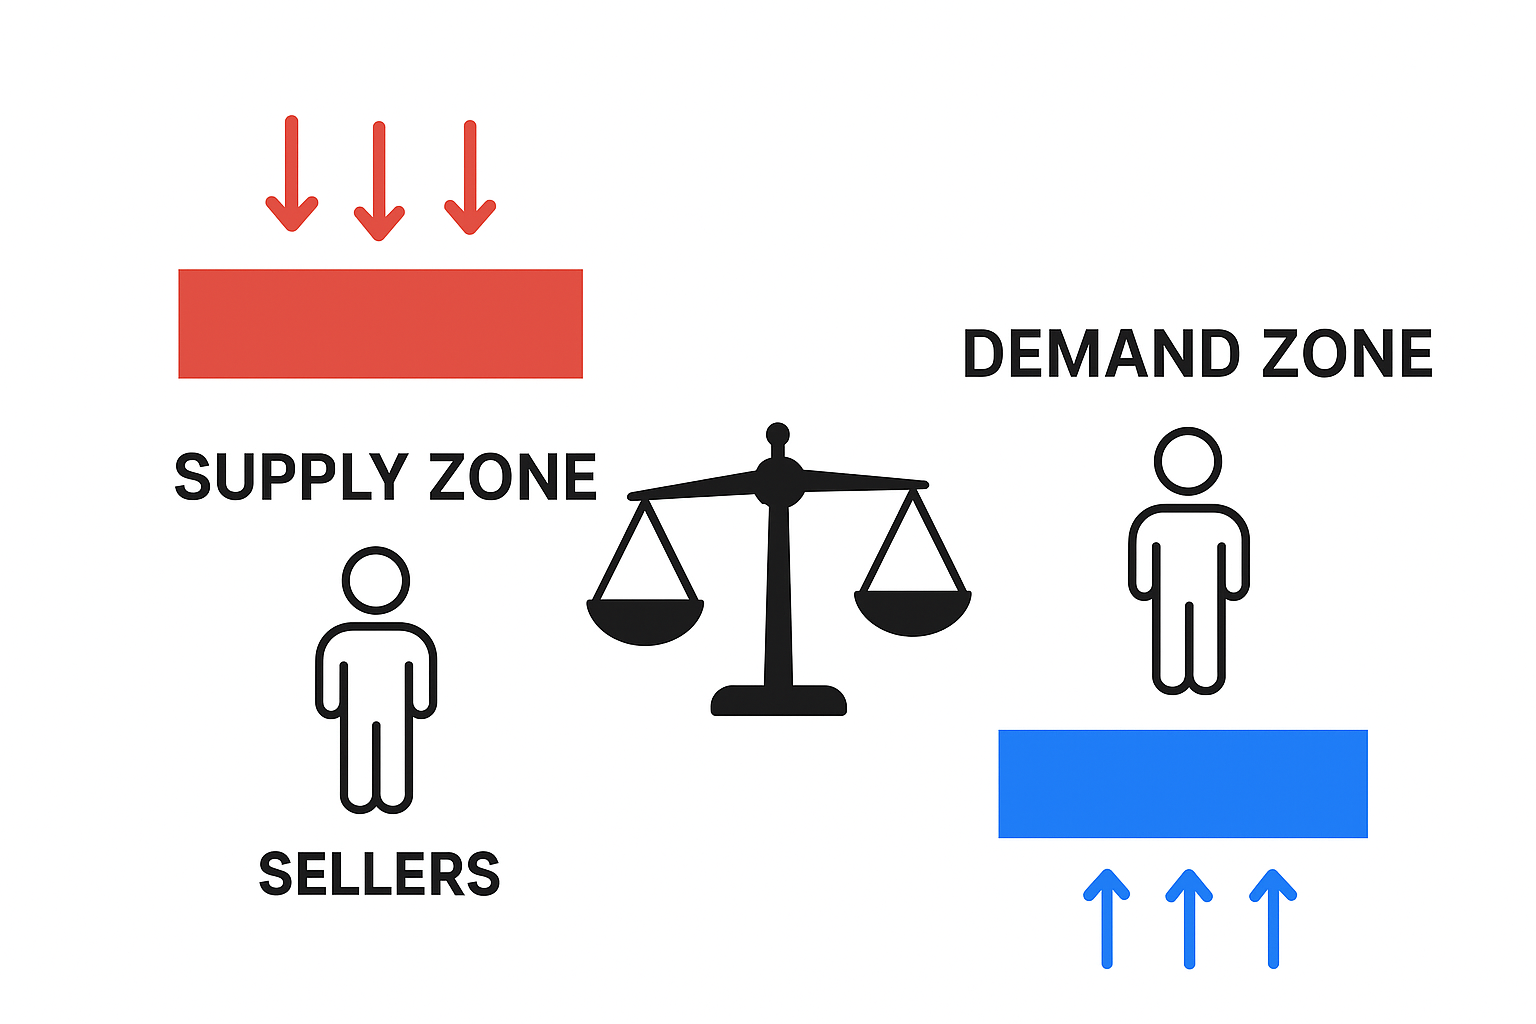
Supply & Demand Concept: Where institutional orders create imbalances
Demand Zone (Buying Zone)
A demand zone forms when price drops to a level where institutions start aggressively buying, overwhelming sellers and causing price to shoot upward. The zone represents the origin of the bullish move—where buyers gained control.
Demand Zone Characteristics:
- Forms at the base before a strong upward move
- Shows where buyers overwhelmed sellers
- Contains unfilled buy limit orders
- Price should spend minimal time in the zone
Supply Zone (Selling Zone)
A supply zone forms when price rallies to a level where institutions start aggressively selling, overwhelming buyers and causing price to drop sharply. This marks the origin of the bearish move—where sellers gained control.
Supply Zone Characteristics:
- Forms at the top before a strong downward move
- Shows where sellers overwhelmed buyers
- Contains unfilled sell limit orders
- Price should leave the zone quickly
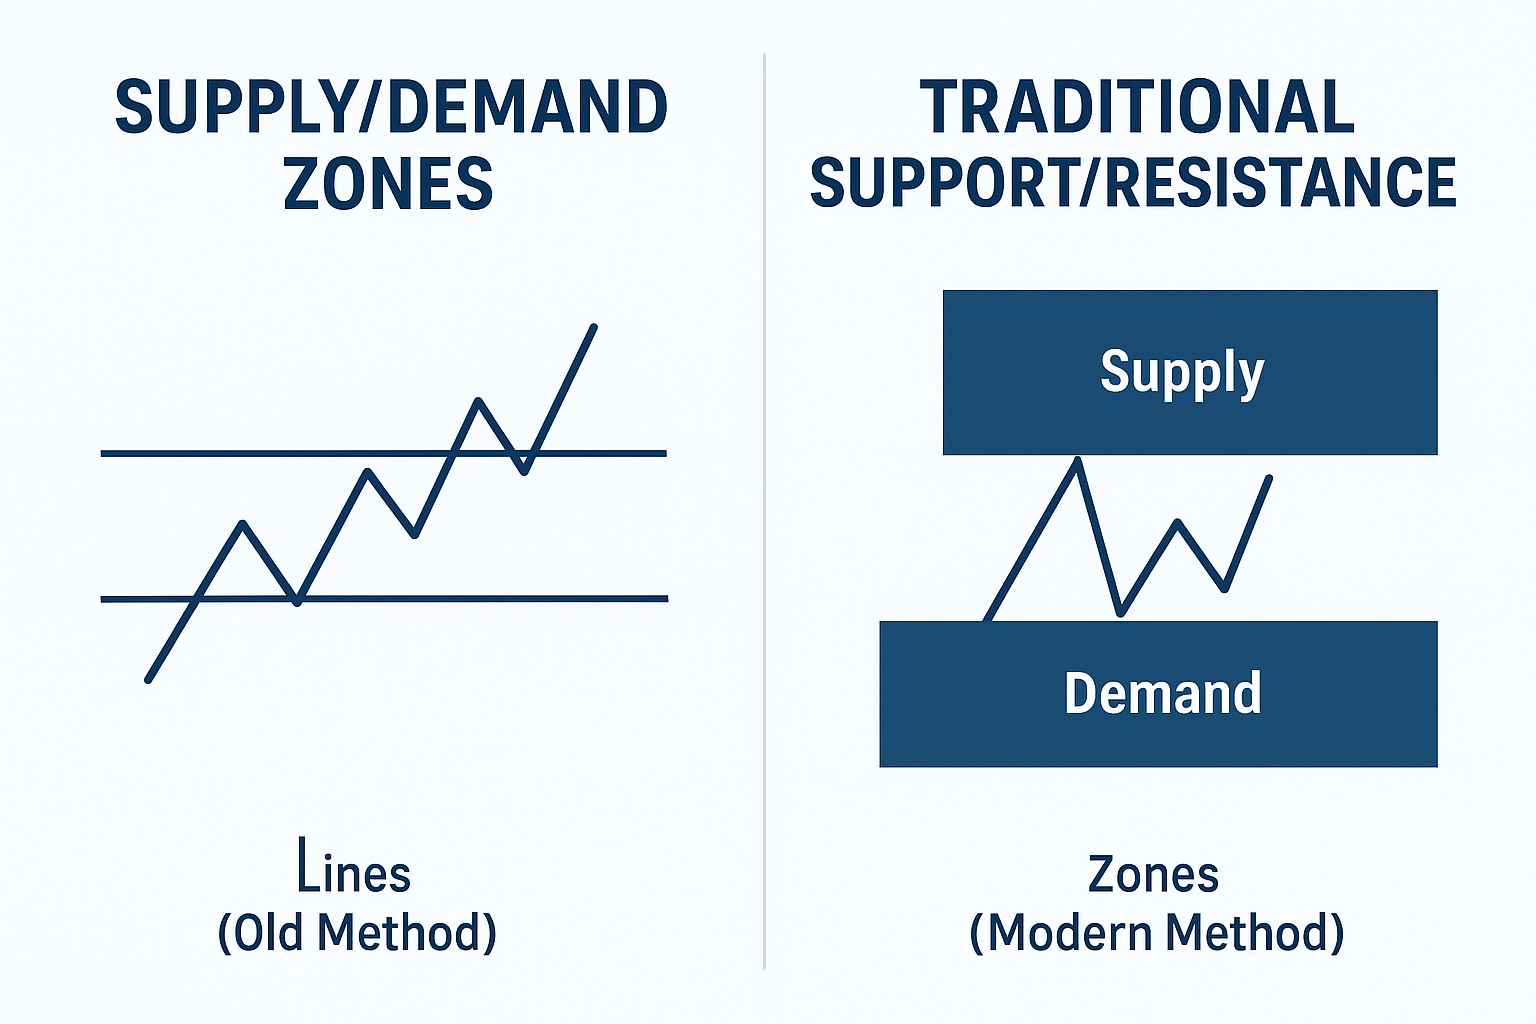
Key Difference: Supply/Demand zones are where moves BEGIN, not where price bounces multiple times
Identifying Bullish Demand Zones
A high-quality demand zone must meet specific criteria. Not every price bounce is a demand zone. You are looking for areas where institutions placed large buy orders that have not been completely filled yet.
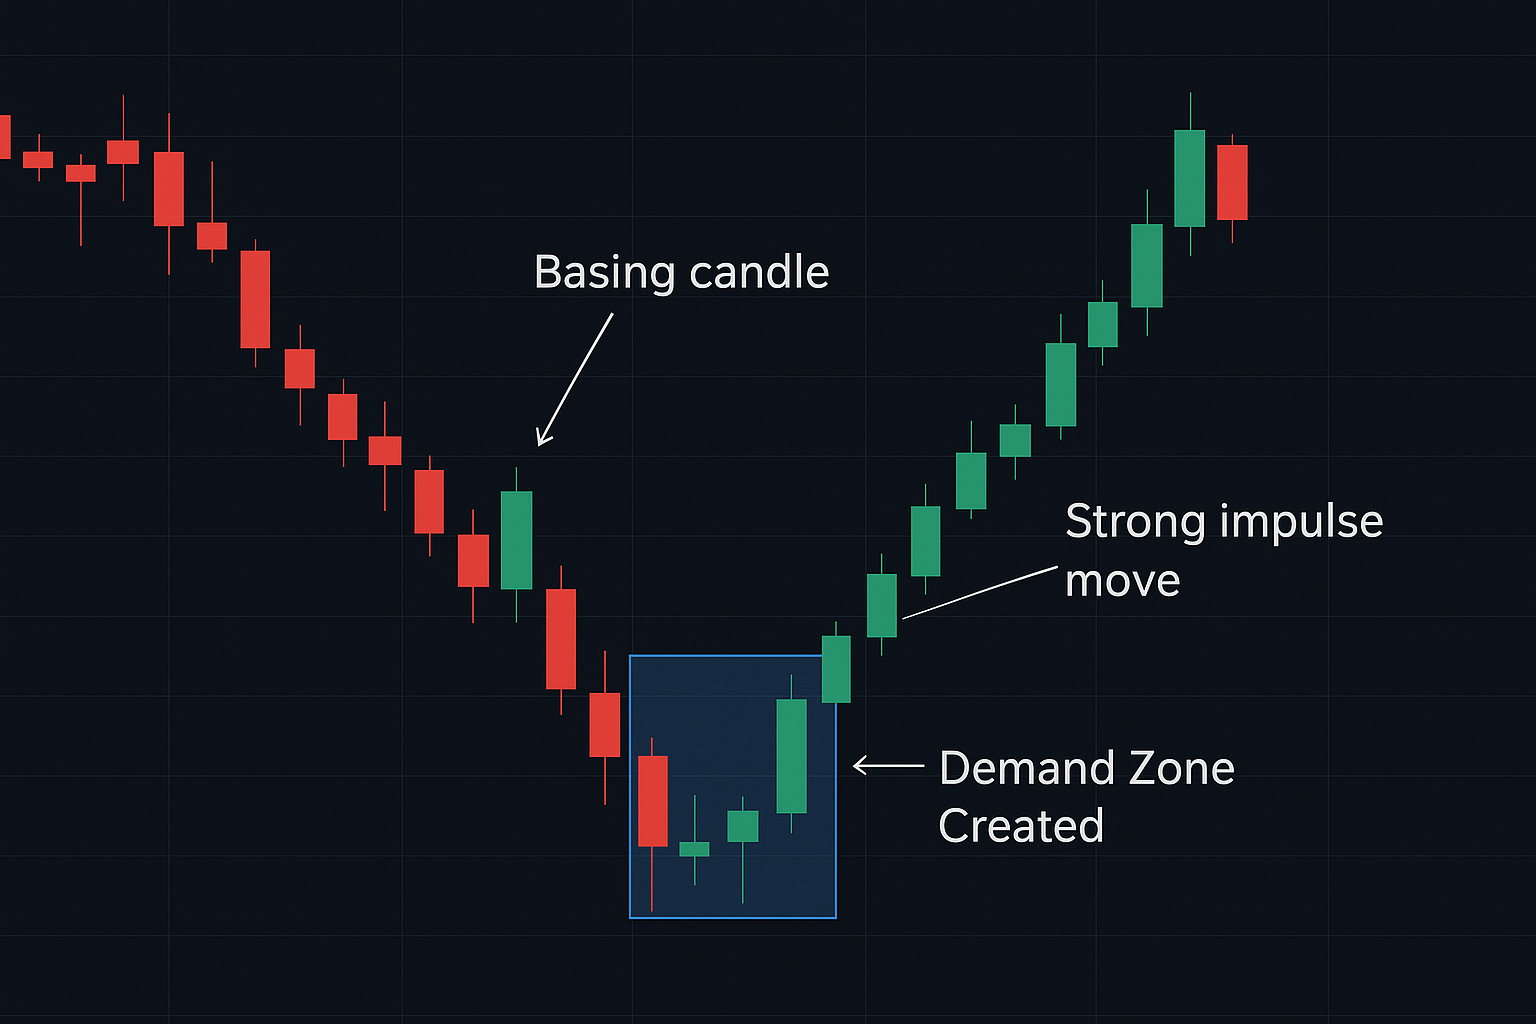
Bullish Demand Zone: Price base before explosive upward move
📋 How to Mark Demand Zones:
- Find the basing area: Look for where price consolidated before shooting up
- Identify the last red candle: Mark the low and body of the final bearish candle before the rally
- Check the move away: The move upward should be strong and impulsive (not gradual)
- Verify freshness: The zone should NOT have been tested yet (fresh zones are best)
- Draw the zone: Create a rectangle from the low to the high of the basing area
Rally-Base-Rally (RBR) Pattern
The RBR pattern is the highest-quality demand zone setup. It shows a clear rally, followed by a consolidation (base), followed by another rally in the same direction. This indicates strong institutional buying.
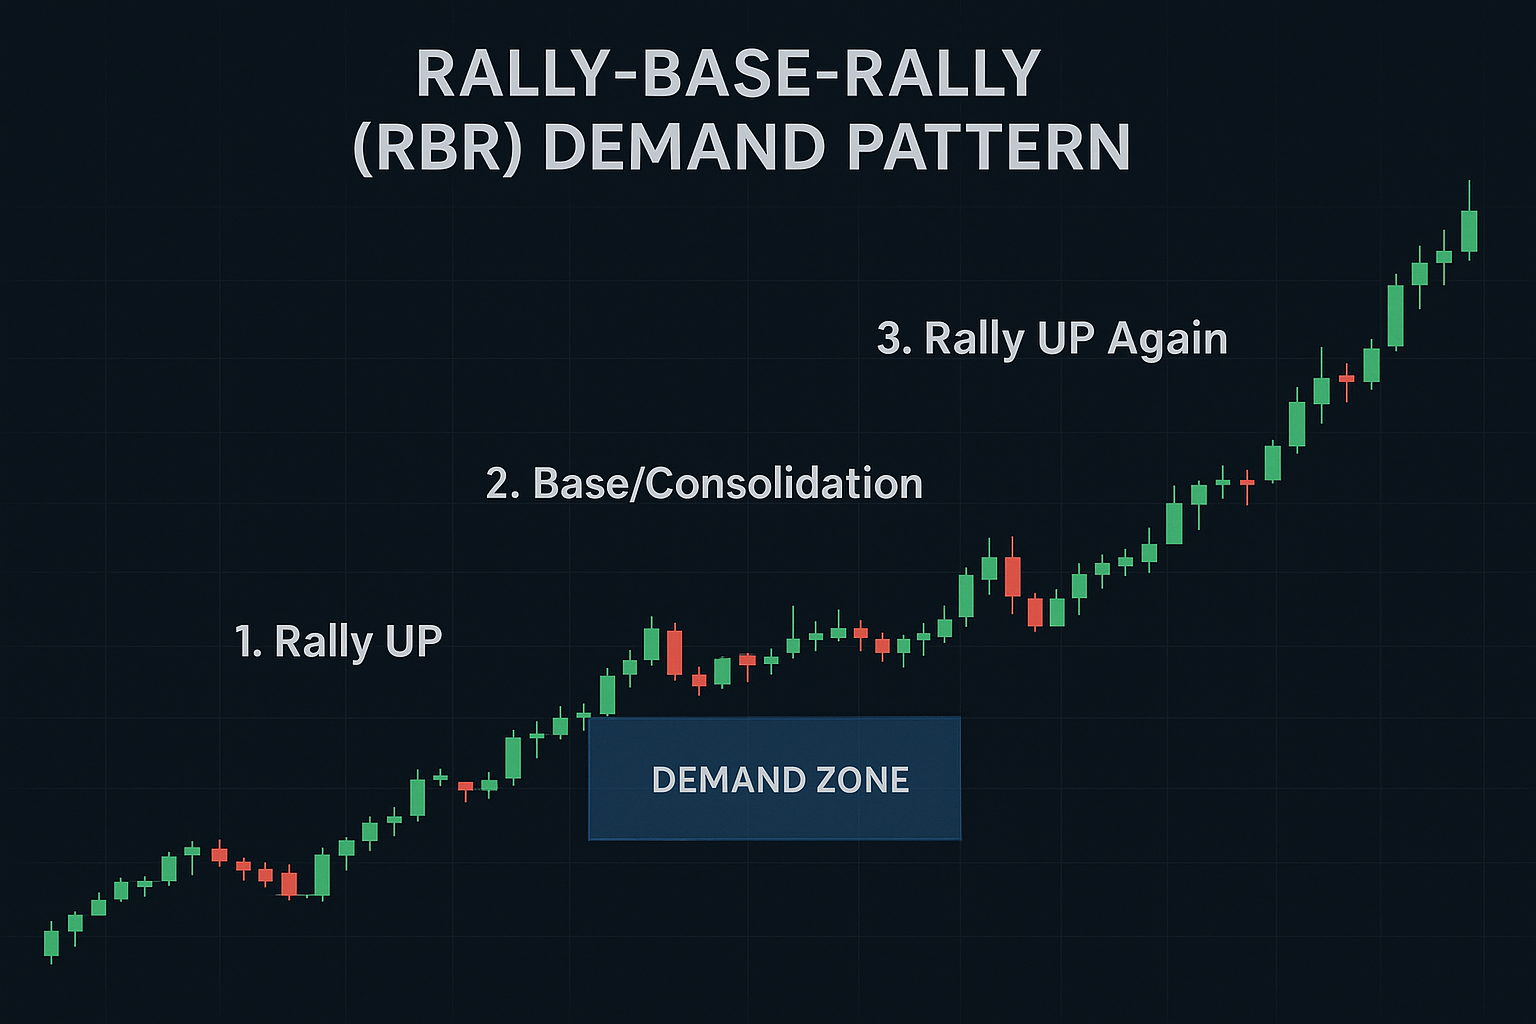
RBR Pattern: Rally → Base → Rally = High-probability demand zone
✅ Trading RBR Demand Zones:
- Wait for return: Price must come back to the base zone
- Look for rejection: Bullish pin bars or engulfing candles at the zone
- Enter on confirmation: Buy when price shows bullish reversal signs
- Stop loss below zone: Place SL 5-10 pips below the demand zone low
Identifying Bearish Supply Zones
Supply zones are the inverse of demand zones. These mark areas where institutional sellers placed large sell orders, causing price to drop sharply. When price returns to these zones, expect strong selling pressure.
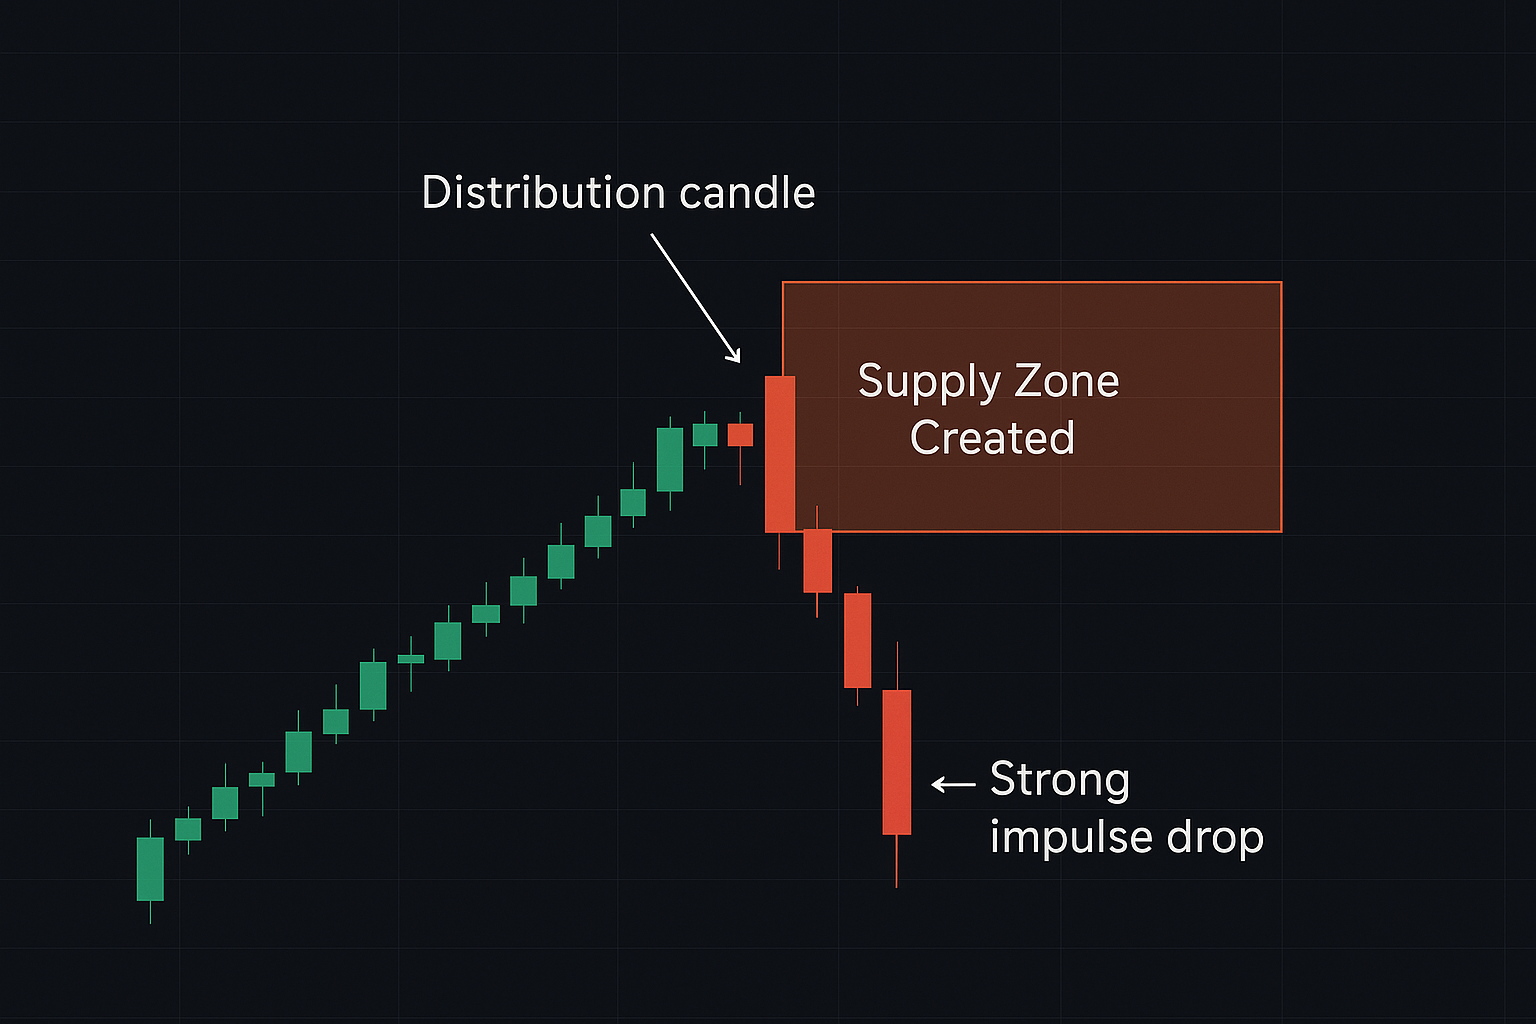
Bearish Supply Zone: Price distribution area before explosive downward move
Drop-Base-Drop (DBD) Pattern
The DBD pattern is the bearish equivalent of RBR. It shows a drop, followed by consolidation (base), followed by another drop. This indicates strong institutional selling and creates high-probability supply zones.
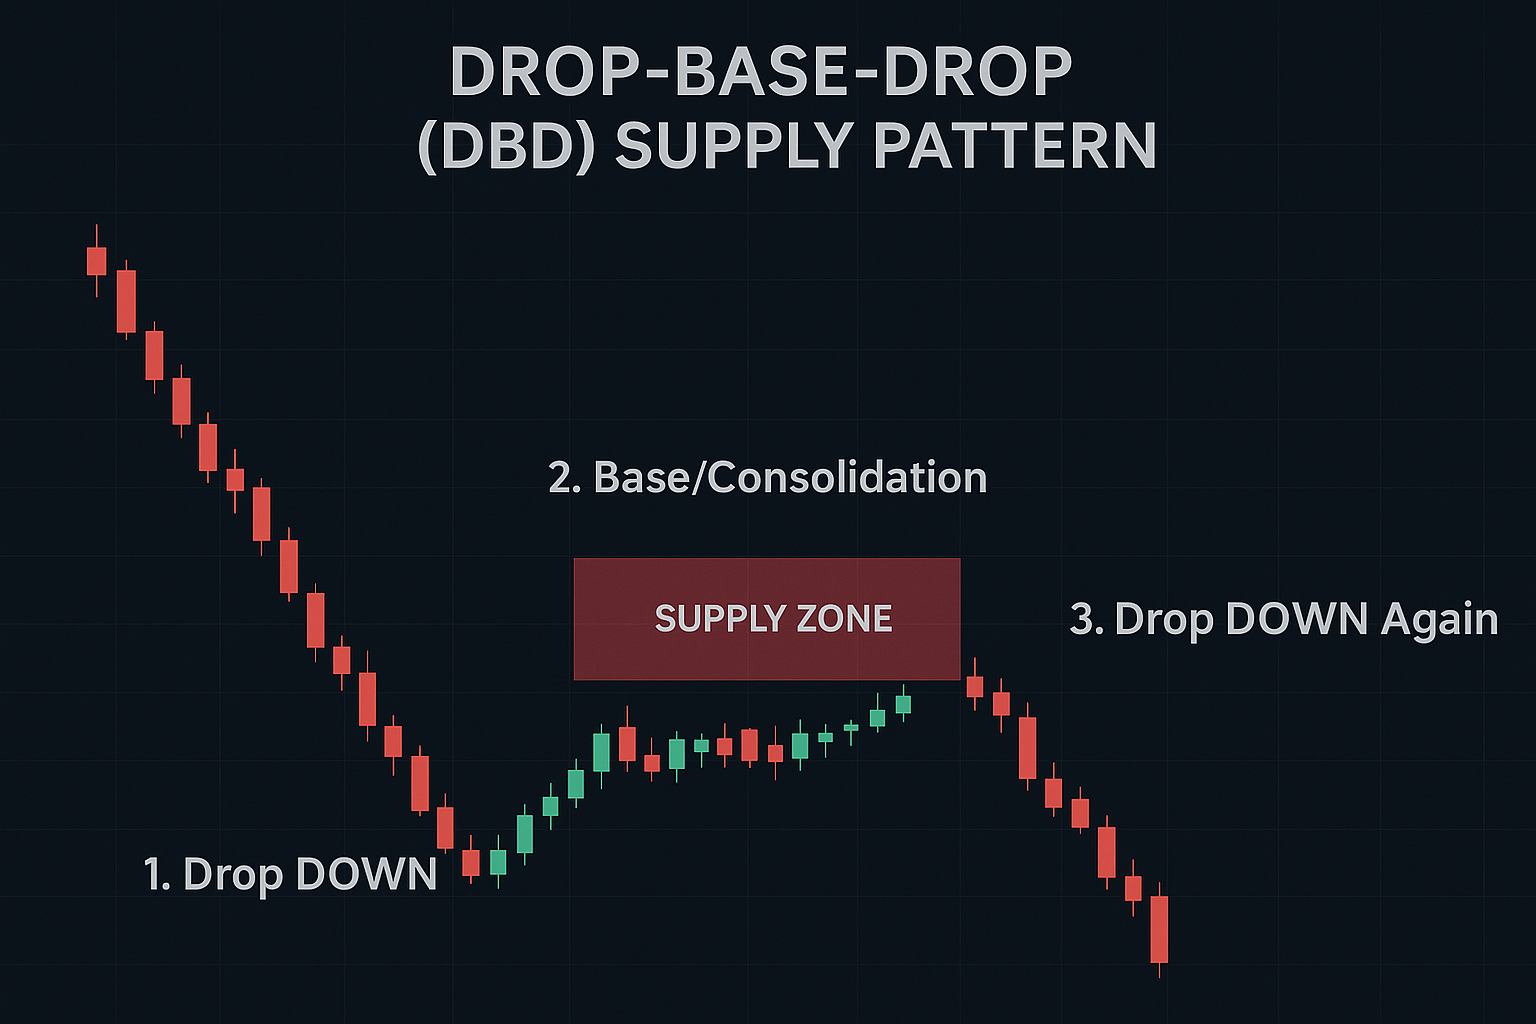
DBD Pattern: Drop → Base → Drop = High-probability supply zone
🎯 Trading DBD Supply Zones:
- Identify the distribution zone: Find where price consolidated before the drop
- Mark the zone: Draw from the low to high of the basing area
- Wait for price return: Be patient for price to rally back up to this zone
- Watch for rejection: Look for bearish pin bars or engulfing patterns
- Enter on confirmation: Sell when bearish reversal is confirmed
- Stop loss above zone: Place SL 5-10 pips above the supply zone high
Pro Tip: First Touch is Golden
The first time price returns to a fresh supply or demand zone is the highest-probability trade. After a zone has been tested once, its strength diminishes significantly. Always prioritize fresh, untested zones.
RBR & DBD Patterns Deep Dive
Rally-Base-Rally (RBR) and Drop-Base-Drop (DBD) patterns are the gold standard of supply and demand trading. These patterns show clear institutional activity and provide the best risk-reward setups.
Why RBR/DBD Patterns Work
Clear Institutional Footprint
The base represents where institutions accumulated/distributed positions. The subsequent move confirms their direction and strength.
Tight Stop Loss
The base zone is typically narrow, allowing you to place stop losses close to your entry for excellent risk-reward ratios (often 1:5+).
🔍 Validating RBR/DBD Quality:
1. Strong Initial Move: The first rally/drop should be impulsive and strong, not gradual
2. Tight Base: The basing area should be relatively compact (2-5 candles ideal)
3. Quick Departure: Price should leave the base area quickly and explosively
4. Fresh Zone: The zone has not been revisited yet (first touch = highest probability)
5. Timeframe Alignment: Confirmed on higher timeframe (4H or Daily)
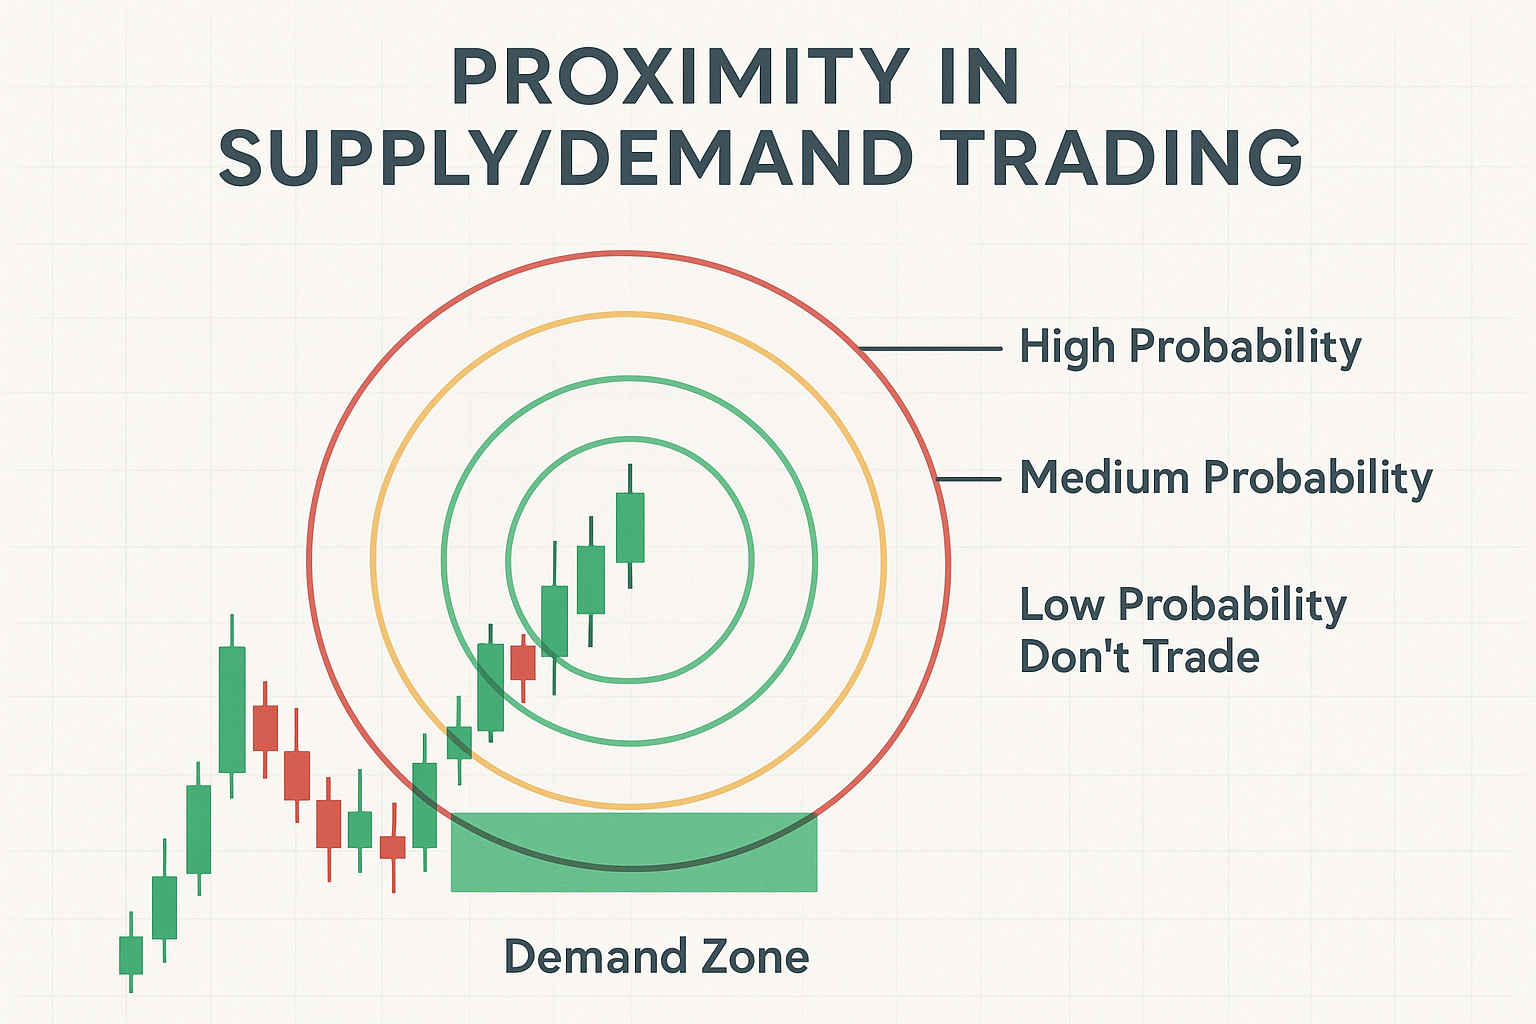
Proximity: Closest zone to current price has highest probability
Zone Quality Factors
Not all supply and demand zones are created equal. Professional traders use specific criteria to filter out low-quality zones and focus only on the highest-probability setups.
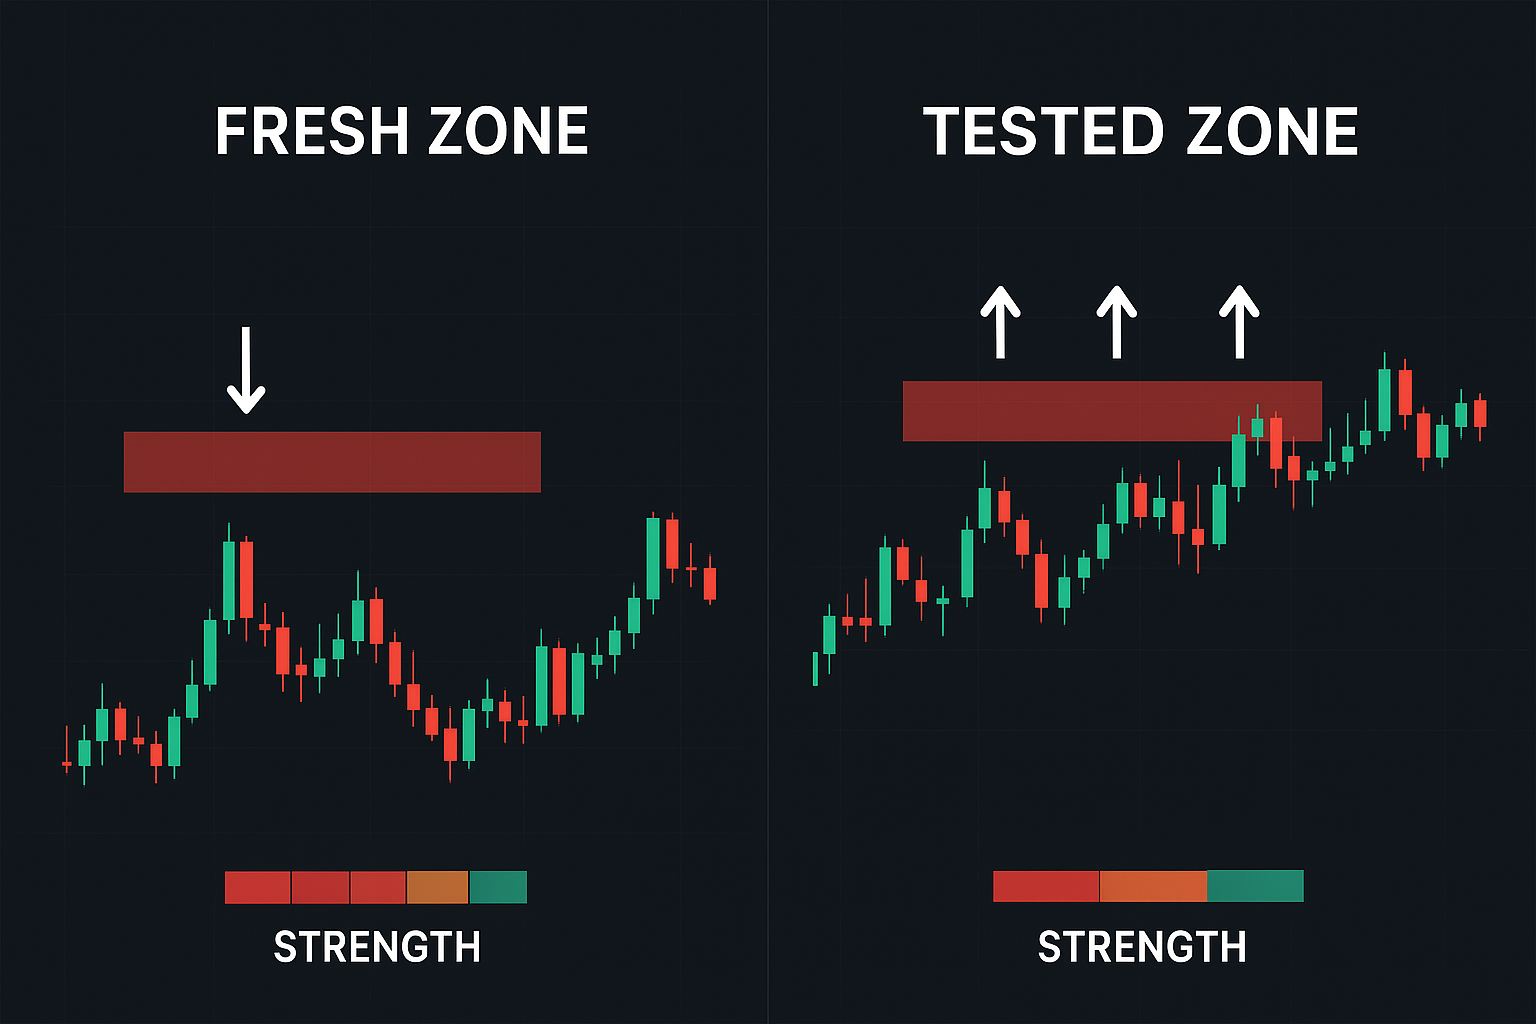
Fresh zones (never tested) vs Tested zones (been touched before)
The 5 Quality Filters
1. Freshness (Most Important)
Fresh zones have NOT been tested. Each time price touches a zone, some institutional orders get filled, weakening the zone.
✅ Trade fresh zones first. Tested zones second (if at all).
2. Strength of Move Away
The move away from the zone should be explosive and impulsive, not slow and gradual.
✅ Look for large candles and strong momentum leaving the zone.
3. Time Spent in Zone
Less time = better quality. Institutions do not hesitate. Quick accumulation/distribution indicates strong conviction.
✅ Ideal: 1-5 candles in the base. Avoid zones with 10+ candles of consolidation.
4. Proximity to Current Price
The closest zone to current price has the highest probability of holding because market conditions have not changed much.
✅ Trade the nearest high-quality zone. Ignore distant zones.
5. Higher Timeframe Confirmation
Zones visible on Daily or 4H charts are more significant than zones only visible on 15M charts.
✅ Best trades have Daily/4H zone + 1H/15M entry confirmation.
The Perfect Zone Checklist
- ✅ Fresh (never touched before)
- ✅ Strong impulsive move away
- ✅ Minimal time spent in zone (1-5 candles)
- ✅ Closest zone to current price
- ✅ Visible on 4H or Daily chart
- ✅ Forms RBR or DBD pattern
- ✅ Aligns with higher timeframe trend
If a zone checks 5+ of these boxes, you have a high-probability trade setup!
Complete Supply & Demand Trading Strategy
Now let us combine everything into a complete, step-by-step trading strategy. This is exactly how professional supply and demand traders identify and execute high-probability setups.
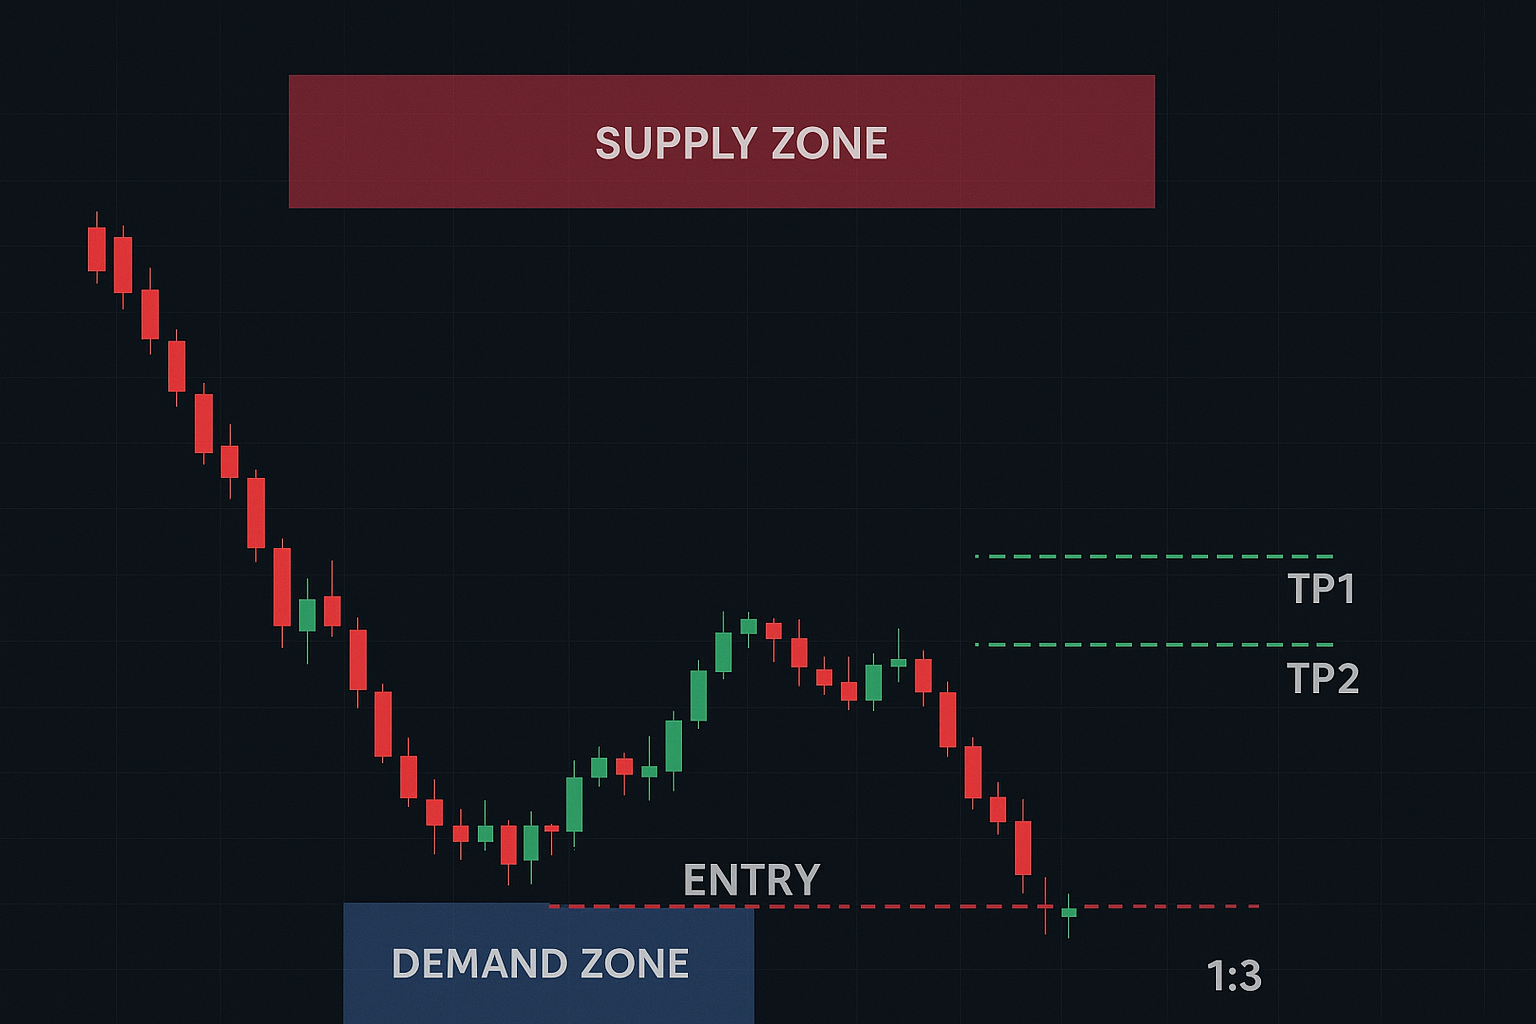
Complete Trade Setup: All elements working together
7-Step Trading Process
Start on Daily/4H Chart
Open Daily chart. Identify the overall trend. Mark the most recent, high-quality supply/demand zones using the 5 quality filters.
Look for RBR/DBD Patterns
Focus on zones that show clear Rally-Base-Rally or Drop-Base-Drop patterns. These are your highest-probability setups.
Filter for Fresh Zones
Prioritize zones that have not been tested yet. These have the highest probability of causing reversals.
Wait for Price to Return
Set alerts at your zones. Be patient and wait for price to come back to your marked zones. Never chase price!
Drop to Lower Timeframe (1H/15M)
When price reaches your zone, switch to 1H or 15M chart. Look for entry confirmation signals (reversal patterns, pin bars, engulfing).
Enter on Confirmation
Enter when you see clear rejection of the zone. Do not enter blindly—wait for price to show it respects the zone.
Set Stop Loss & Take Profit
SL: 5-10 pips beyond the zone. TP: Opposite supply/demand zone or 3:1 minimum risk-reward.
Entry Confirmation Signals
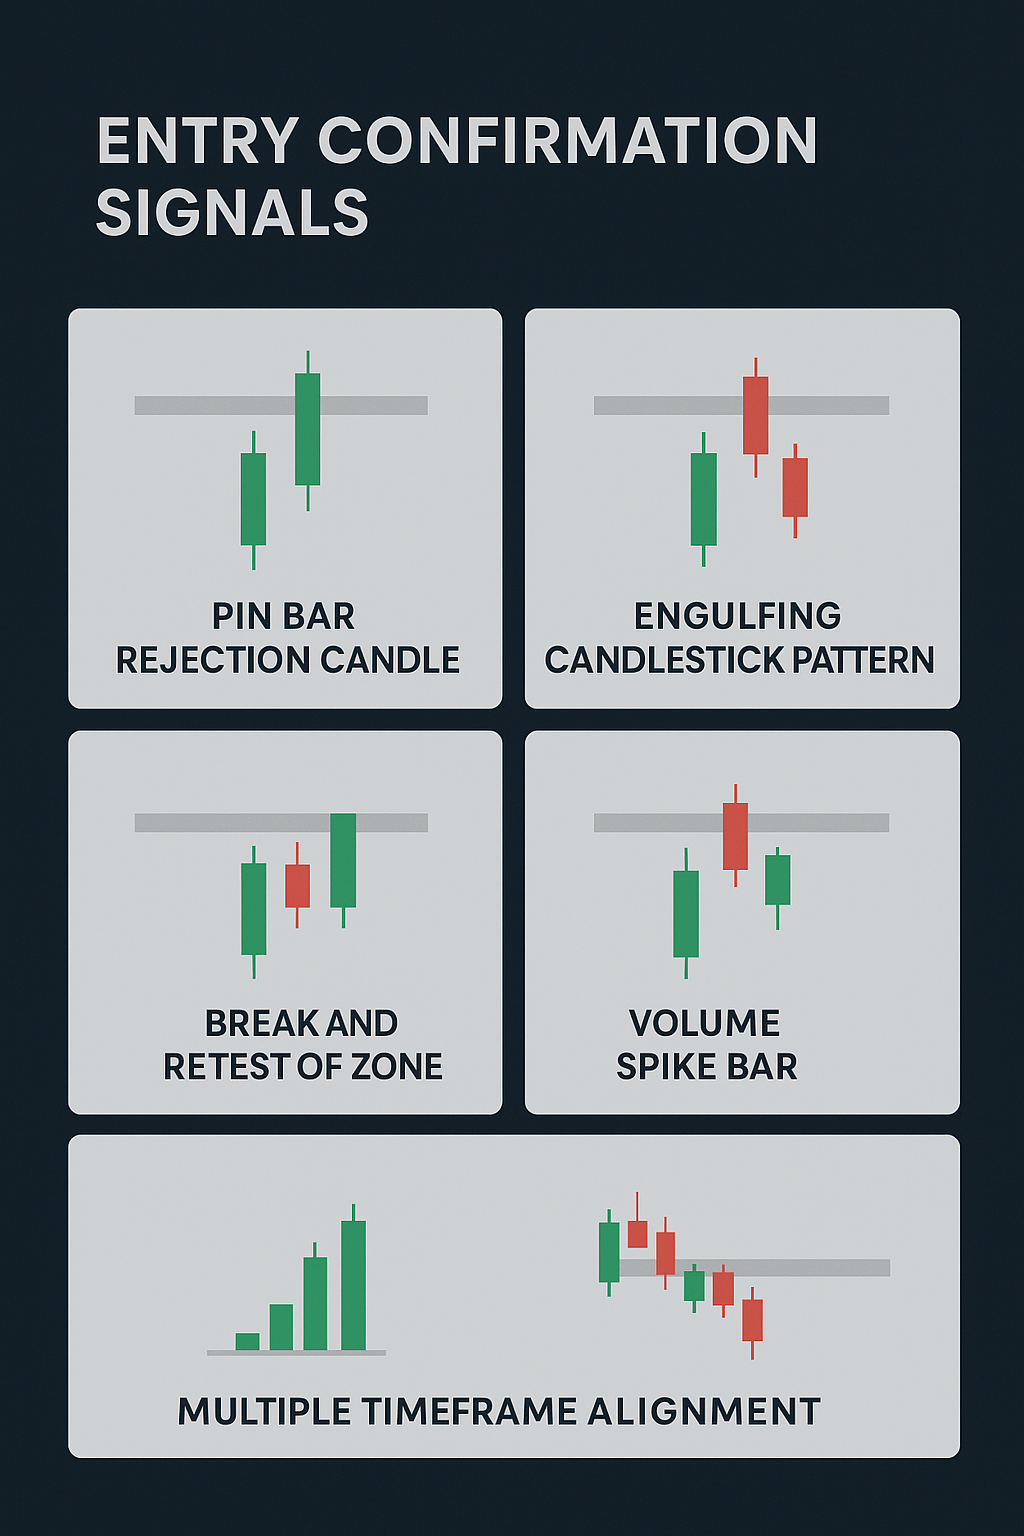
Entry Confirmation: Wait for these signals before entering trades
📍 Pin Bar / Hammer
Best confirmation
- • Long wick into zone
- • Small body
- • Shows strong rejection
📊 Engulfing Candle
Strong signal
- • Bullish engulfs bearish
- • Shows buyer control
- • Volume spike ideal
⚡ Break of Structure
Momentum confirmation
- • Breaks previous high/low
- • Shows direction shift
- • Combine with zone touch
Multi-Timeframe Approach
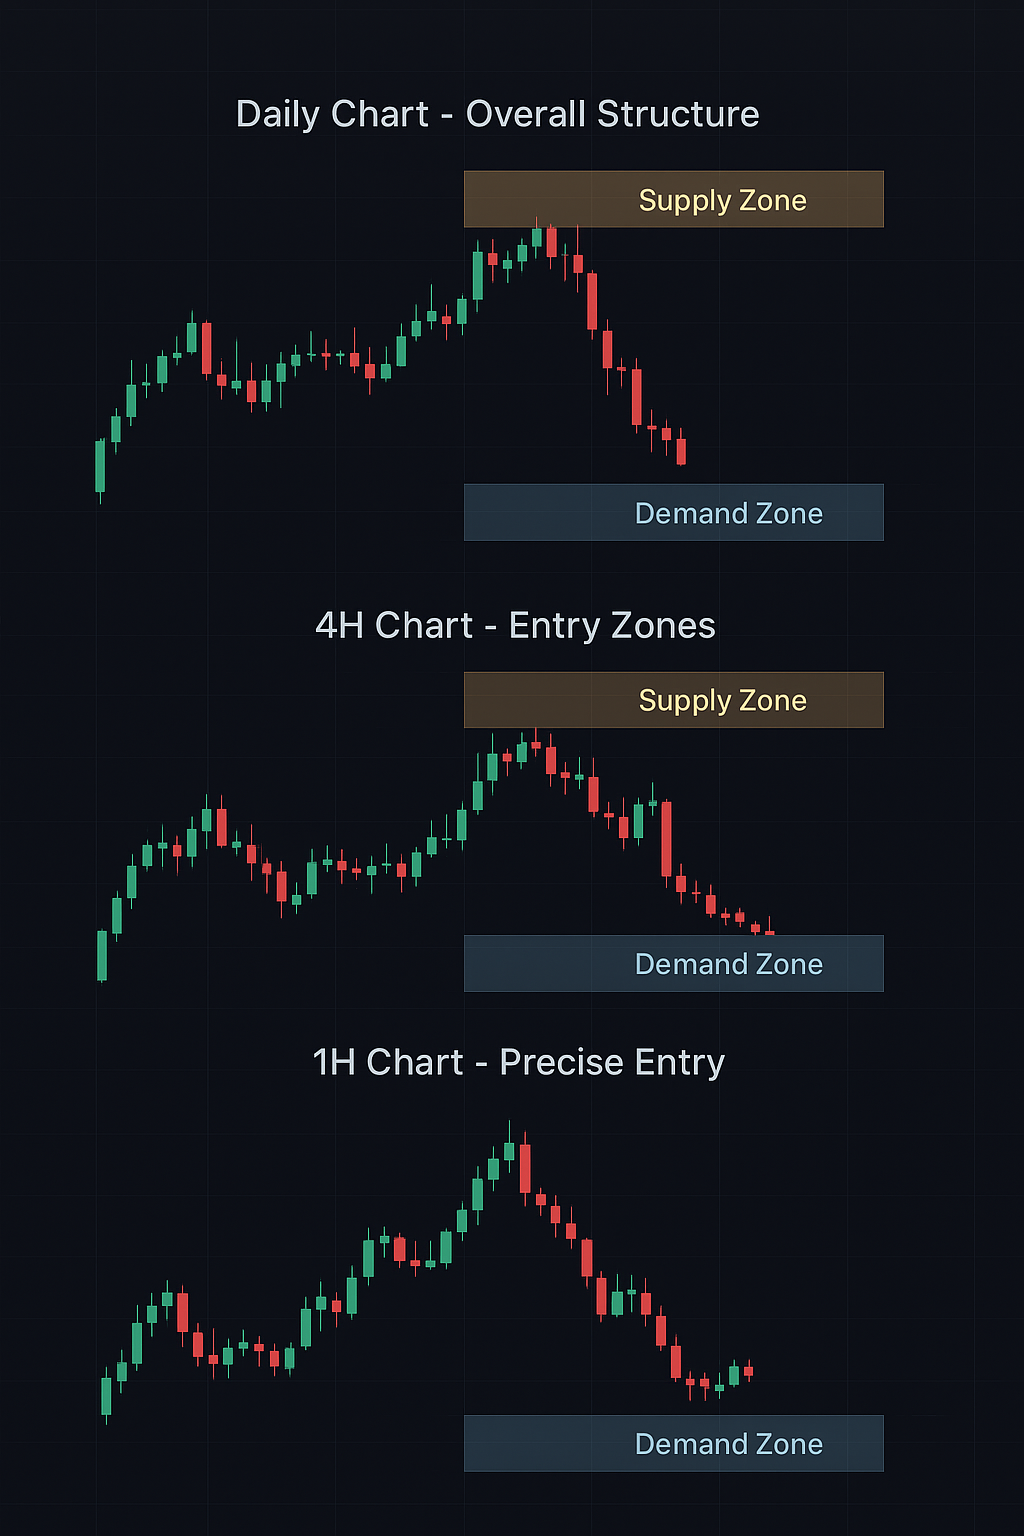
Top-Down Analysis: Daily zone → 4H confirmation → 1H entry
🎯 Perfect Multi-Timeframe Setup:
Daily Chart: Identify overall trend and major supply/demand zones
4H Chart: Confirm zone quality and mark RBR/DBD patterns
1H Chart: Watch for price approaching your zone, look for confluence
15M Chart: Get precise entry using confirmation signals (pin bars, engulfing)
Risk Management for Supply & Demand Trading
Even the highest-quality supply and demand zones can fail. Proper risk management ensures you survive losing streaks and compound your winners effectively.
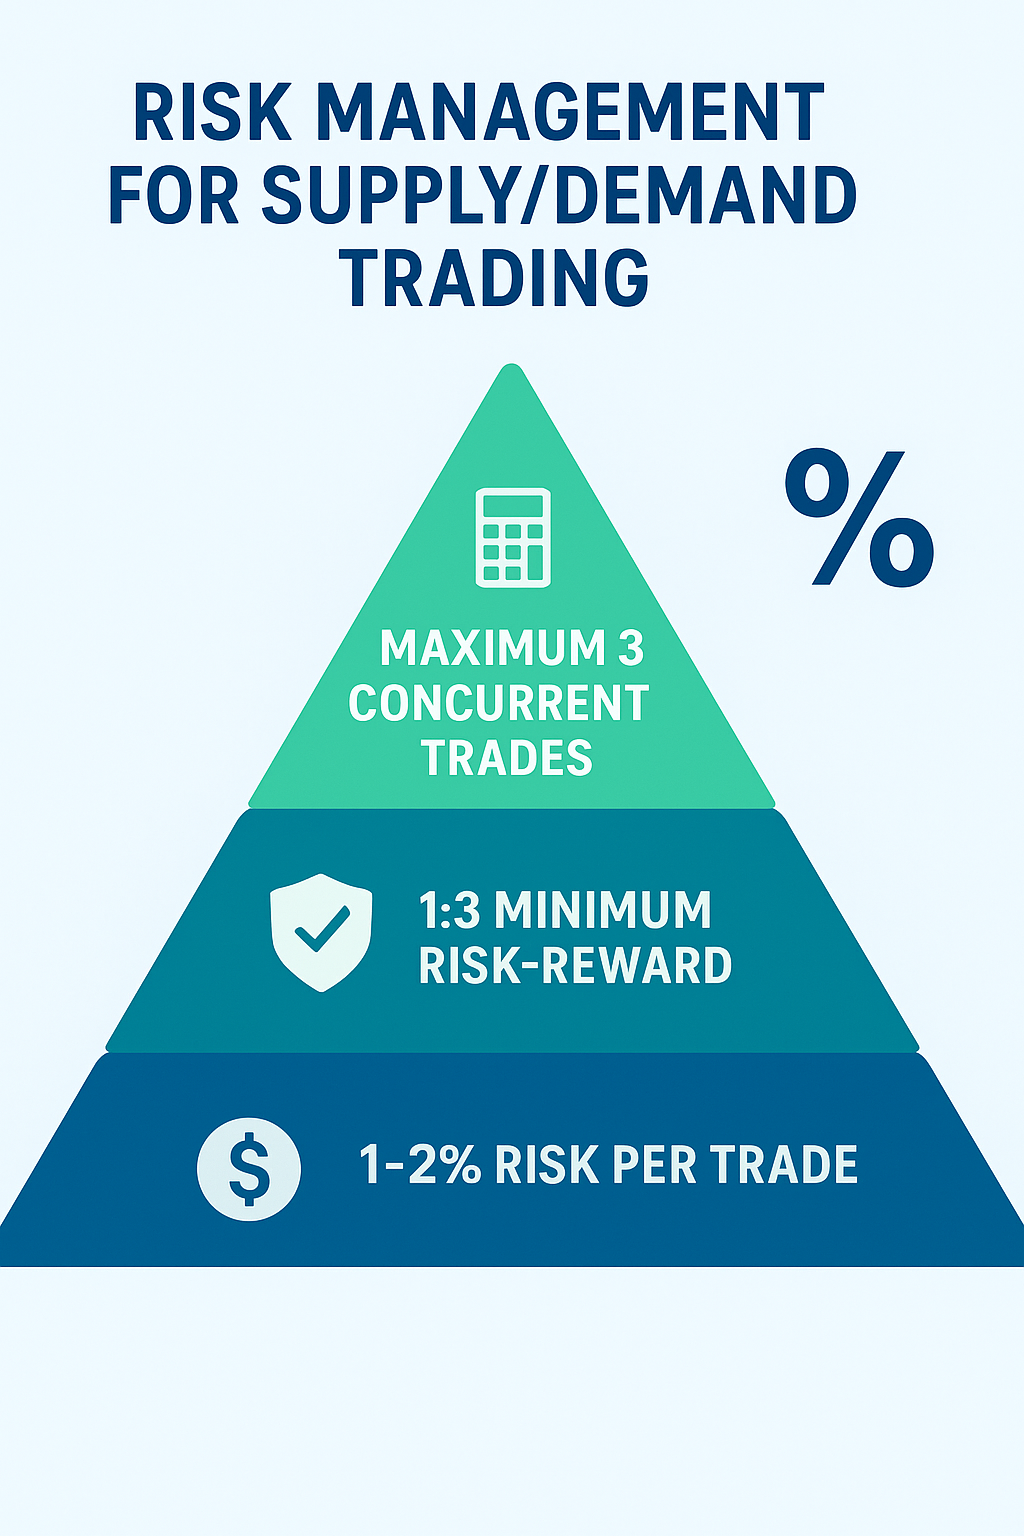
Proper Risk Management: Never risk more than 1-2% per trade
Position Sizing Rules
- • Risk 1% per trade (2% maximum on best setups)
- • Calculate lot size based on stop loss distance
- • Smaller zones = larger position size possible
- • Never increase risk because this one looks good
Risk-Reward Targets
- • Minimum 1:3 risk-reward ratio
- • Aim for opposite supply/demand zone as TP
- • Fresh zones often give 1:5 or better
- • Consider partial profits at 1:2, let rest run
📍 Stop Loss Placement:
- Demand zones: Place SL 5-10 pips BELOW the zone low
- Supply zones: Place SL 5-10 pips ABOVE the zone high
- Buffer space: Give enough room for spread and small wicks
- Move to BE: When trade is 1:1 in profit, move SL to breakeven
The 3-Strike Rule
If a specific supply/demand zone fails 3 times in a row, stop trading that zone. It means institutional orders have been filled and the zone is no longer valid.
This rule protects you from stubbornly trading zones that have lost their edge.
Common Supply & Demand Trading Mistakes
Most traders fail with supply and demand because they make these critical mistakes. Learn from them and accelerate your path to profitability.
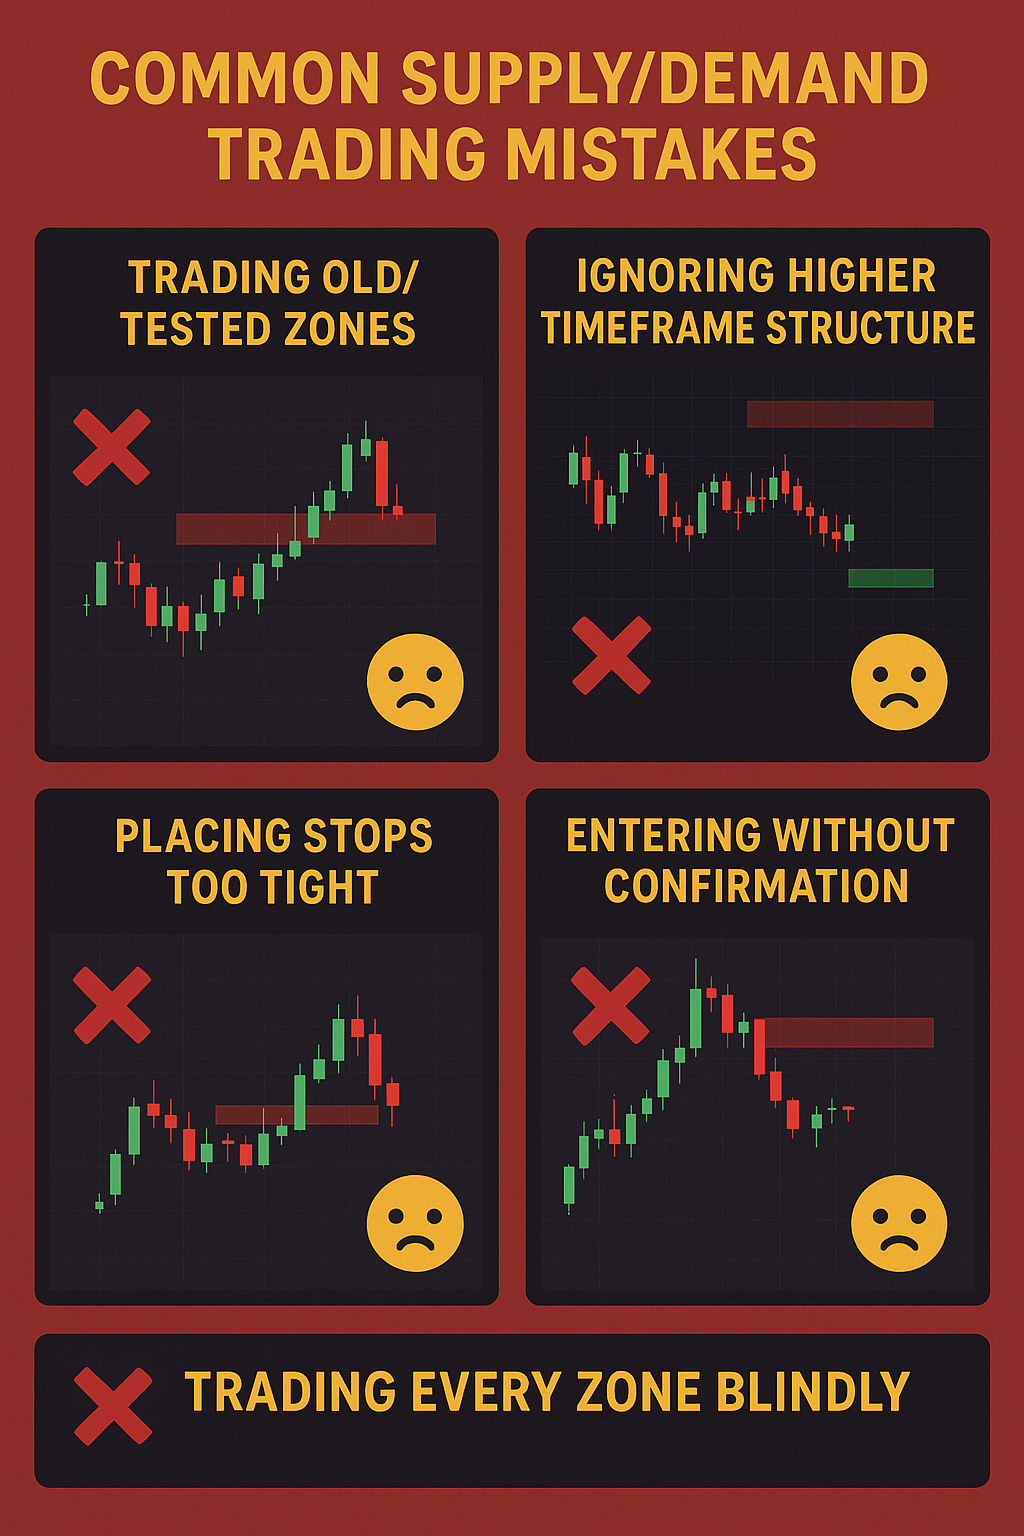
Top Mistakes: Trading tested zones, wrong zone markup, no confirmation
Mistake 1: Trading Tested Zones
The Problem: Trading zones that have already been touched multiple times.
Solution: Focus on FRESH zones only. Each touch weakens the zone significantly. First touch = best probability.
Mistake 2: Confusing S/D with Support/Resistance
The Problem: Marking areas where price bounced multiple times as supply/demand zones.
Solution: Supply/Demand zones are where moves BEGIN, not where price bounces repeatedly. Look for the origin of explosive moves.
Mistake 3: Entering Without Confirmation
The Problem: Entering immediately when price touches a zone without waiting for rejection signals.
Solution: Always wait for confirmation (pin bars, engulfing, break of structure) on lower timeframe before entering.
Mistake 4: Marking Too Many Zones
The Problem: Drawing dozens of zones on your chart, causing analysis paralysis.
Solution: Mark only 2-3 highest-quality zones per chart. Focus on the closest fresh zones to current price.
Mistake 5: Ignoring Higher Timeframe Context
The Problem: Trading 15M zones without checking if they align with 4H/Daily trend and zones.
Solution: Always start analysis from Daily/4H. Trade in direction of higher timeframe zones for best win rate.
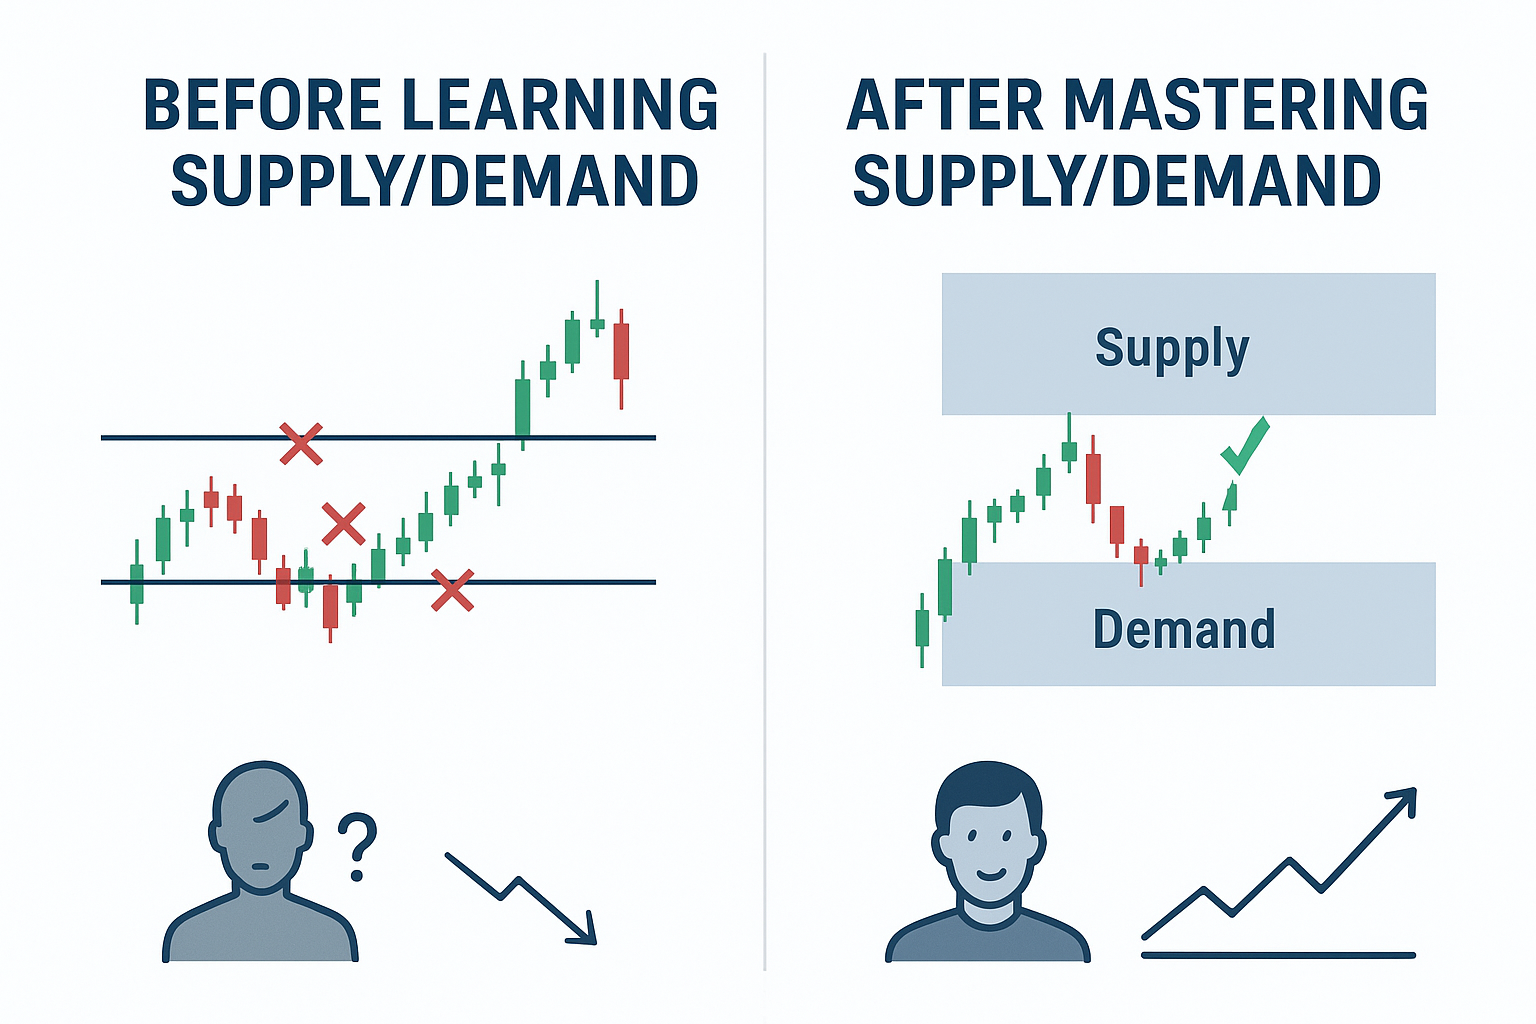
Results Transformation: Before vs After mastering supply and demand trading
Getting Started with Supply & Demand Trading
Supply and demand trading is one of the purest forms of price action analysis. By understanding where institutional orders sit and trading alongside them, you gain a massive edge over retail traders stuck using outdated technical indicators.
Key Takeaways
- Supply/demand zones mark institutional order clusters
- Fresh zones have the highest probability
- RBR/DBD patterns are gold standard setups
- Zone quality filters separate winners from losers
- Always wait for entry confirmation
- Multi-timeframe analysis is critical
- Risk 1-2% per trade with 1:3+ RR minimum
- Patience and discipline are everything
Your Learning Roadmap
Week 1-2: Learn to Mark Zones
Study past charts. Practice marking supply/demand zones, RBR/DBD patterns. Focus on getting zone identification perfect.
Week 3-4: Apply Quality Filters
Learn to filter zones using the 5 quality factors. Mark only the highest-probability zones. Less is more.
Month 2: Demo Trade
Start taking setups on demo account. Focus on process, not profit. Journal every trade with screenshots.
Month 3+: Live Trading
Move to live with micro lots. Get comfortable with real money emotions. Scale up slowly as consistency improves.
Trade with Professional Supply/Demand Signals
While you are learning, get access to professional supply and demand trade setups identified by our expert team using institutional-grade analysis.
Continue Your Trading Education
Supply and demand works best when combined with proper risk management, trading psychology, and a solid trading plan. Explore our other resources.
Related Articles
Was this article helpful? Share it with fellow traders!
Back to All Articles