Trend Following Signal Strategy: Complete Guide 2025
Master the art of trend following with proven signal strategies. Learn how to identify strong trends, use signals effectively, and ride profitable trends for maximum gains.
Introduction: Trend Following Signal Strategy
Trend following is one of the most time-tested and profitable trading strategies in forex markets. Based on the simple principle that "the trend is your friend," this strategy capitalizes on the tendency of markets to move in sustained directional patterns. When combined with effective signal identification, trend following becomes a powerful approach for consistent profitability.
Unlike strategies that try to predict market reversals or trade against momentum, trend following embraces market direction and rides profitable trends until clear reversal signals appear. This approach has been used successfully by professional traders, hedge funds, and systematic trading systems for decades, proving its effectiveness across different market conditions and timeframes.
This comprehensive 2025 guide will teach you everything you need to master trend following signal strategies. You'll learn how to identify strong trends, recognize high-probability entry and exit signals, manage risk effectively, and implement advanced techniques used by professional traders. Whether you're a beginner or experienced trader, this guide provides the knowledge and tools to implement trend following successfully.
What is Trend Following?
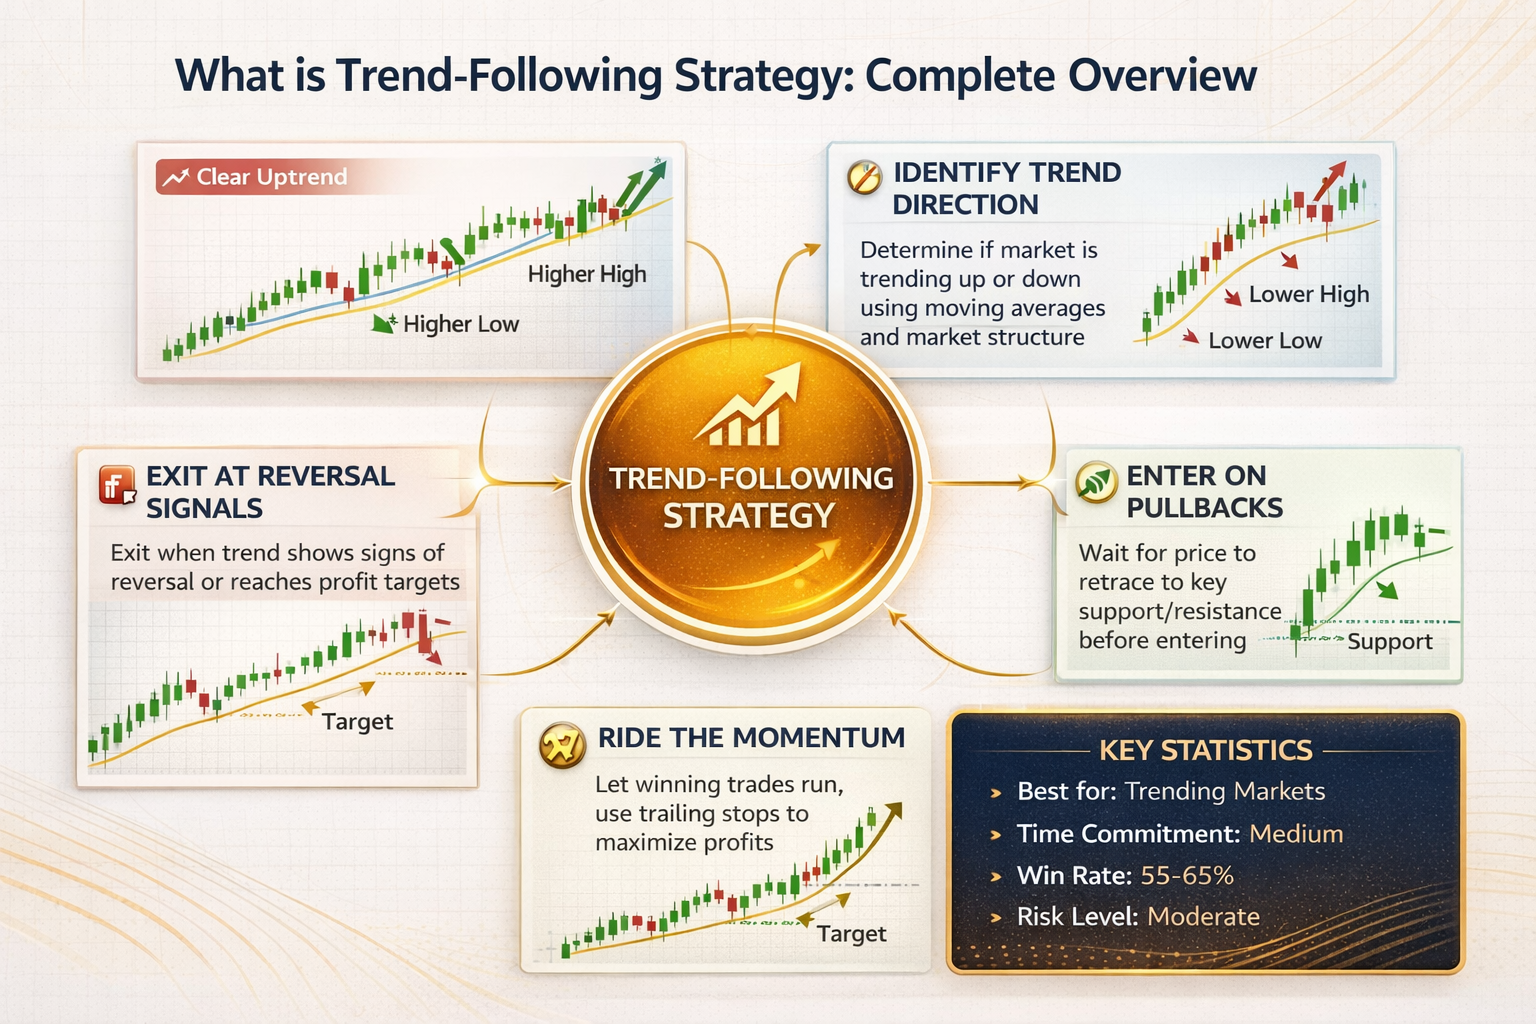
Trend following is a trading methodology that identifies and follows the direction of established market trends. Instead of trying to predict where prices will go, trend followers wait for trends to establish themselves, then enter positions in the direction of the trend and hold until the trend shows signs of reversal.
The core philosophy of trend following is based on the observation that markets tend to move in trends more often than they move randomly. Once a trend begins, it often continues for extended periods due to various factors including momentum, investor psychology, and fundamental drivers. Trend followers capitalize on this persistence by entering trades after trend confirmation and exiting when reversal signals appear.
Key Principles of Trend Following:
- Trade with the Trend: Always trade in the direction of the established trend. Never fight the trend or try to pick tops and bottoms. The trend is your friend until it ends.
- Let Winners Run: Trend following requires patience to hold winning trades. Cut losses quickly but let profitable trades develop fully. Most profits come from a few large winning trades.
- Cut Losses Quickly: When a trend reverses, exit immediately. Don't hold losing positions hoping for a reversal. Small, controlled losses are essential for long-term success.
- Use Multiple Timeframes: Higher timeframe trends are more reliable. Always align your trades with the trend on the next higher timeframe. Daily trend takes precedence over 4-hour, 4-hour over 1-hour.
- Wait for Confirmation: Don't enter trades on assumptions. Wait for clear trend confirmation through price action, indicators, and signal confirmation. Patience is crucial.
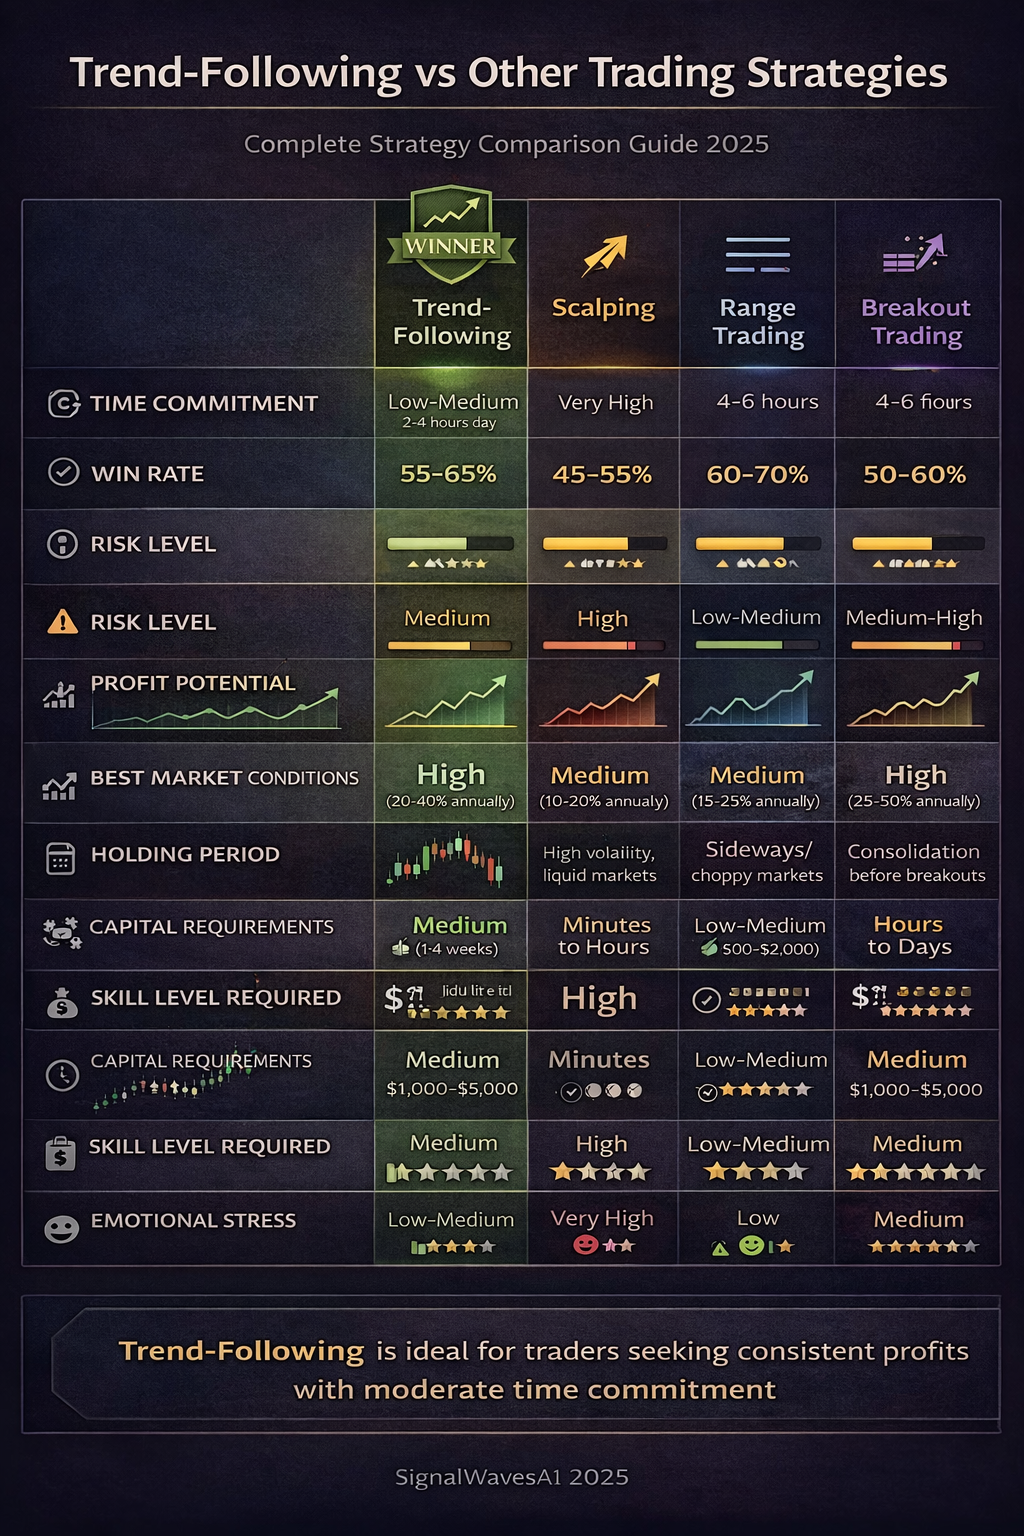
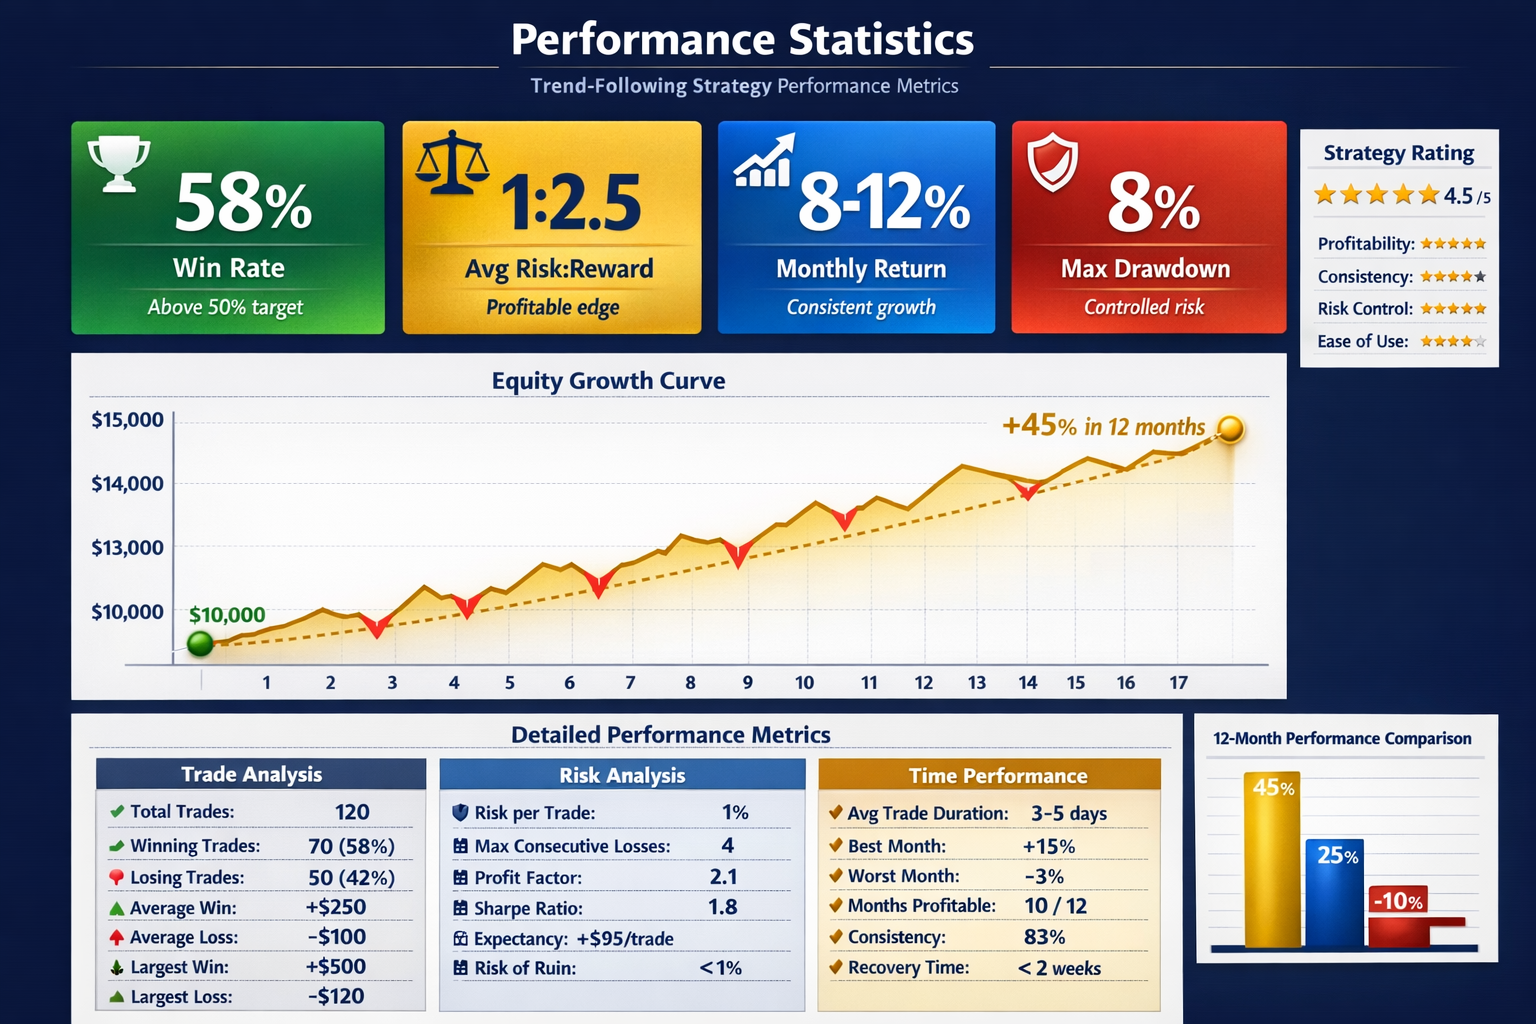
- Accept Lower Win Rates: Trend following typically has 40-50% win rates but remains profitable due to high risk-reward ratios. Focus on expectancy (average profit per trade) rather than win rate.
Trend following works because markets exhibit momentum and persistence. When a currency pair begins trending, it often continues due to fundamental factors, institutional participation, and psychological factors. Trend followers don't need to predict why a trend exists—they simply need to identify it and follow it until it ends.
The strategy is particularly effective in forex markets because currency pairs often trend for extended periods due to interest rate differentials, economic cycles, and central bank policies. These fundamental drivers create sustained directional movements that trend following strategies can capture effectively.
How to Identify Trends
Identifying trends accurately is the foundation of successful trend following. A trend is a sustained directional movement in price, and recognizing it early (but not too early) is crucial. There are several reliable methods to identify trends, and using multiple methods together provides the strongest confirmation.
1. Price Action Analysis
The most fundamental way to identify trends is through price action:
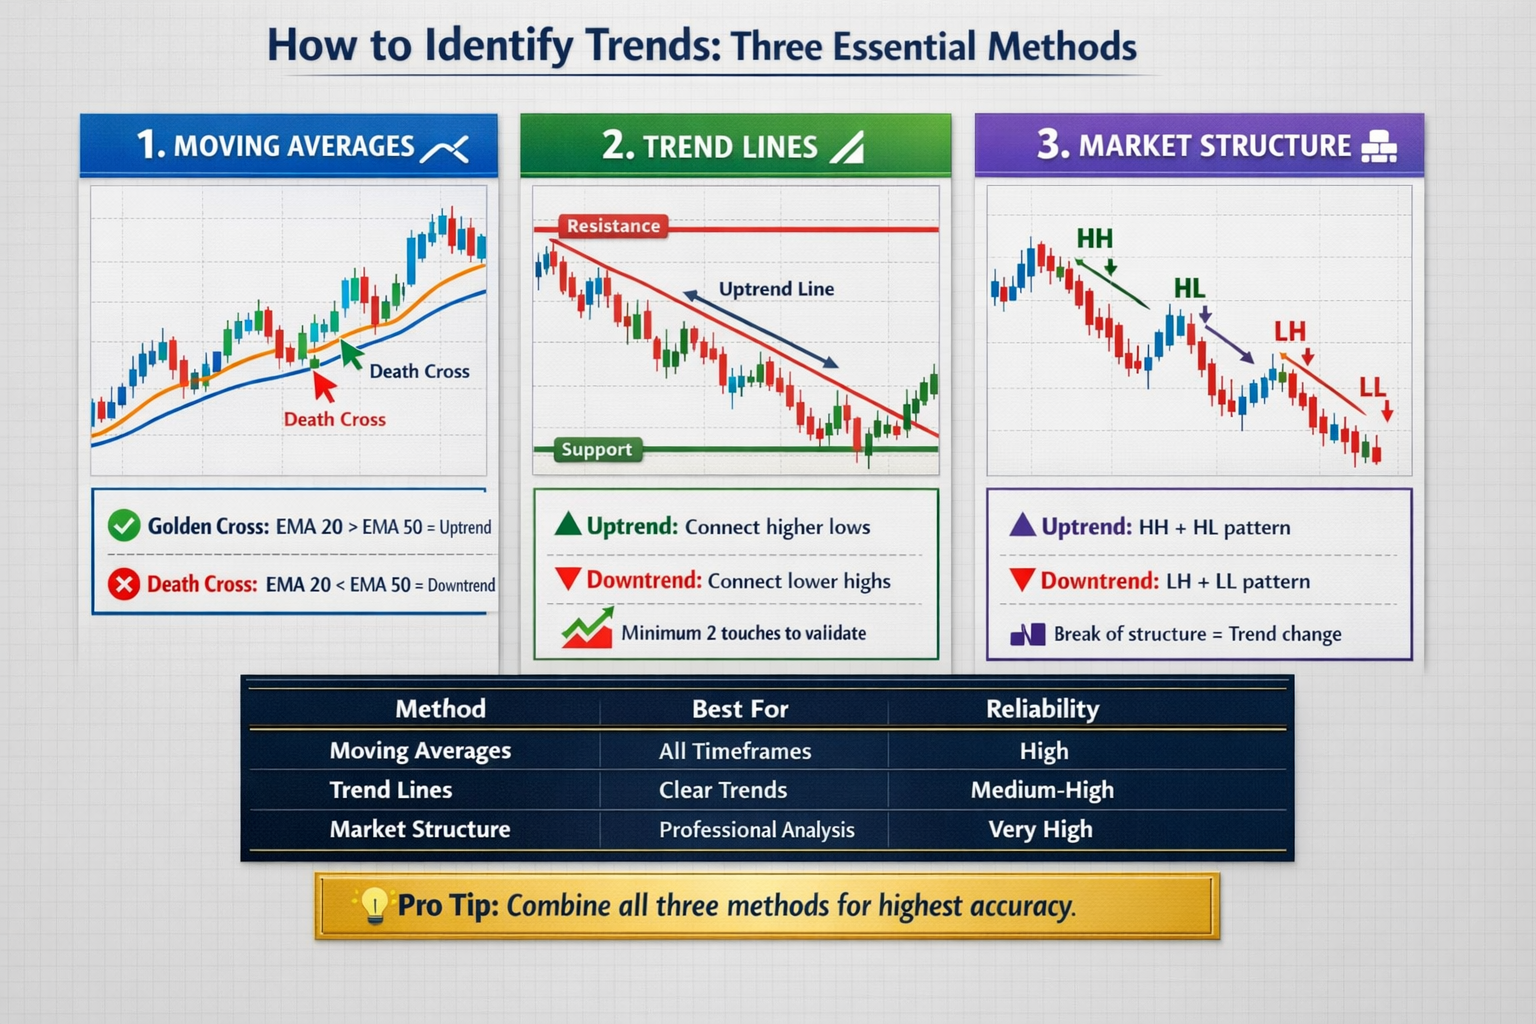
- Uptrend: Characterized by higher highs (HH) and higher lows (HL). Each swing high is higher than the previous, and each swing low is also higher. This creates a series of ascending peaks and troughs.
- Downtrend: Characterized by lower highs (LH) and lower lows (LL). Each swing high is lower than the previous, and each swing low is also lower. This creates a series of descending peaks and troughs.
- Sideways/Range: When price moves between horizontal support and resistance without clear directional bias. Trend following should be avoided in ranging markets.
2. Moving Averages
Moving averages are powerful trend identification tools:
- Price Above Moving Averages: When price consistently trades above key moving averages (50, 100, 200 EMA), an uptrend is likely. The further price is above the moving averages, the stronger the uptrend.
- Price Below Moving Averages: When price consistently trades below key moving averages, a downtrend is likely. The further price is below, the stronger the downtrend.
- Moving Average Slope: The angle of moving averages indicates trend strength. Steeply angled moving averages suggest strong trends, while flat or sideways moving averages suggest weak or no trend.
- Moving Average Alignment: In strong trends, shorter moving averages are above longer ones (50 EMA \> 100 EMA > 200 EMA for uptrends). This "golden cross" alignment confirms trend strength.
3. Trend Lines
Trend lines connect swing highs or swing lows to visualize trend direction:
- Uptrend Line: Connect two or more swing lows. Price should respect this line as support. The more times price touches the trend line without breaking, the stronger the trend.
- Downtrend Line: Connect two or more swing highs. Price should respect this line as resistance. Breaking above a downtrend line often signals trend reversal.
- Trend Line Breaks: When price breaks through a trend line, it often signals trend weakening or reversal. However, false breaks are common, so wait for confirmation.
4. Multiple Timeframe Analysis
The most reliable trend identification uses multiple timeframes:
- Higher Timeframe Trend: Always identify the trend on the next higher timeframe. If trading on 4-hour charts, check the daily trend. If trading on 1-hour, check the 4-hour trend.
- Trend Alignment: The strongest setups occur when trends align across multiple timeframes. For example, daily uptrend + 4-hour uptrend + 1-hour uptrend = very strong bullish setup.
- Counter-Trend Trading: Avoid trading against the higher timeframe trend. Even if a lower timeframe shows a counter-trend move, the higher timeframe trend will likely prevail.
Trend Strength Checklist:
- Price making clear higher highs/higher lows (uptrend) or lower highs/lower lows (downtrend)
- Price consistently above/below key moving averages (50, 100, 200 EMA)
- Moving averages aligned in trend direction (shorter above longer for uptrend)
- Trend visible on multiple timeframes (higher timeframe confirms lower timeframe)
- Volume supporting trend direction (higher volume on trend moves)
- ADX above 25 indicating strong trend (not ranging market)
Types of Trend Following Signals
Trend following signals come in various forms, each with different strengths and applications. Understanding different signal types helps you choose the most appropriate signals for your trading style and market conditions.
1. Moving Average Crossover Signals
Moving average crossovers are among the most popular trend following signals:
- Golden Cross: When a shorter moving average (e.g., 50 EMA) crosses above a longer moving average (e.g., 200 EMA), signaling potential uptrend start. This is a bullish signal.
- Death Cross: When a shorter moving average crosses below a longer moving average, signaling potential downtrend start. This is a bearish signal.
- Advantages: Simple, objective, removes emotion, works well in trending markets, widely used by institutions.
- Disadvantages: Lagging indicator (signals come after trend starts), many false signals in ranging markets, requires patience for signals to develop.
2. Price Breakout Signals
Breakout signals occur when price breaks through key levels:
- Resistance Breakout: Price breaks above previous resistance levels, signaling potential uptrend continuation. Volume confirmation increases signal reliability.
- Support Breakout: Price breaks below previous support levels, signaling potential downtrend continuation. Often leads to accelerated downward movement.
- Trend Line Breaks: Breaking above downtrend lines or below uptrend lines can signal trend reversals or accelerations.
- Key Levels: Breaking through psychological levels (round numbers, major support/resistance) often triggers strong trend moves.
3. Momentum Signals
Momentum indicators provide signals based on price velocity:
- MACD Signals: MACD line crossing above signal line (bullish), MACD crossing below signal line (bearish), MACD crossing above/below zero line (strong trend confirmation).
- RSI Signals: RSI above 50 with upward momentum (bullish trend), RSI below 50 with downward momentum (bearish trend). RSI divergence can signal trend weakening.
- Momentum Oscillators: Various momentum indicators showing consistent directional bias confirm trend strength and continuation.
4. Pattern-Based Signals
Chart patterns provide visual trend following signals:
- Flag and Pennant Patterns: Continuation patterns that signal trend resumption after brief consolidation. Breakout from these patterns often leads to strong trend continuation.
- Triangle Patterns: Ascending triangles (bullish), descending triangles (bearish). Breakouts from triangles signal trend continuation.
- Cup and Handle: Bullish continuation pattern signaling uptrend resumption after consolidation.
Signal Quality Factors:
- Multiple Confirmations: The best signals have multiple indicators confirming the same direction. For example, moving average crossover + price breakout + momentum confirmation.
- Higher Timeframe Alignment: Signals aligned with higher timeframe trends are significantly more reliable than counter-trend signals.
- Volume Confirmation: Signals accompanied by increased volume are more reliable than low-volume signals.
- Clear Trend Context: Signals in clearly trending markets (ADX > 25) are more reliable than signals in ranging markets.
Best Indicators for Trend Following
Selecting the right indicators is crucial for successful trend following. The best indicators complement each other, providing multiple confirmations of trend direction and strength. Here are the most effective indicators for trend following strategies.
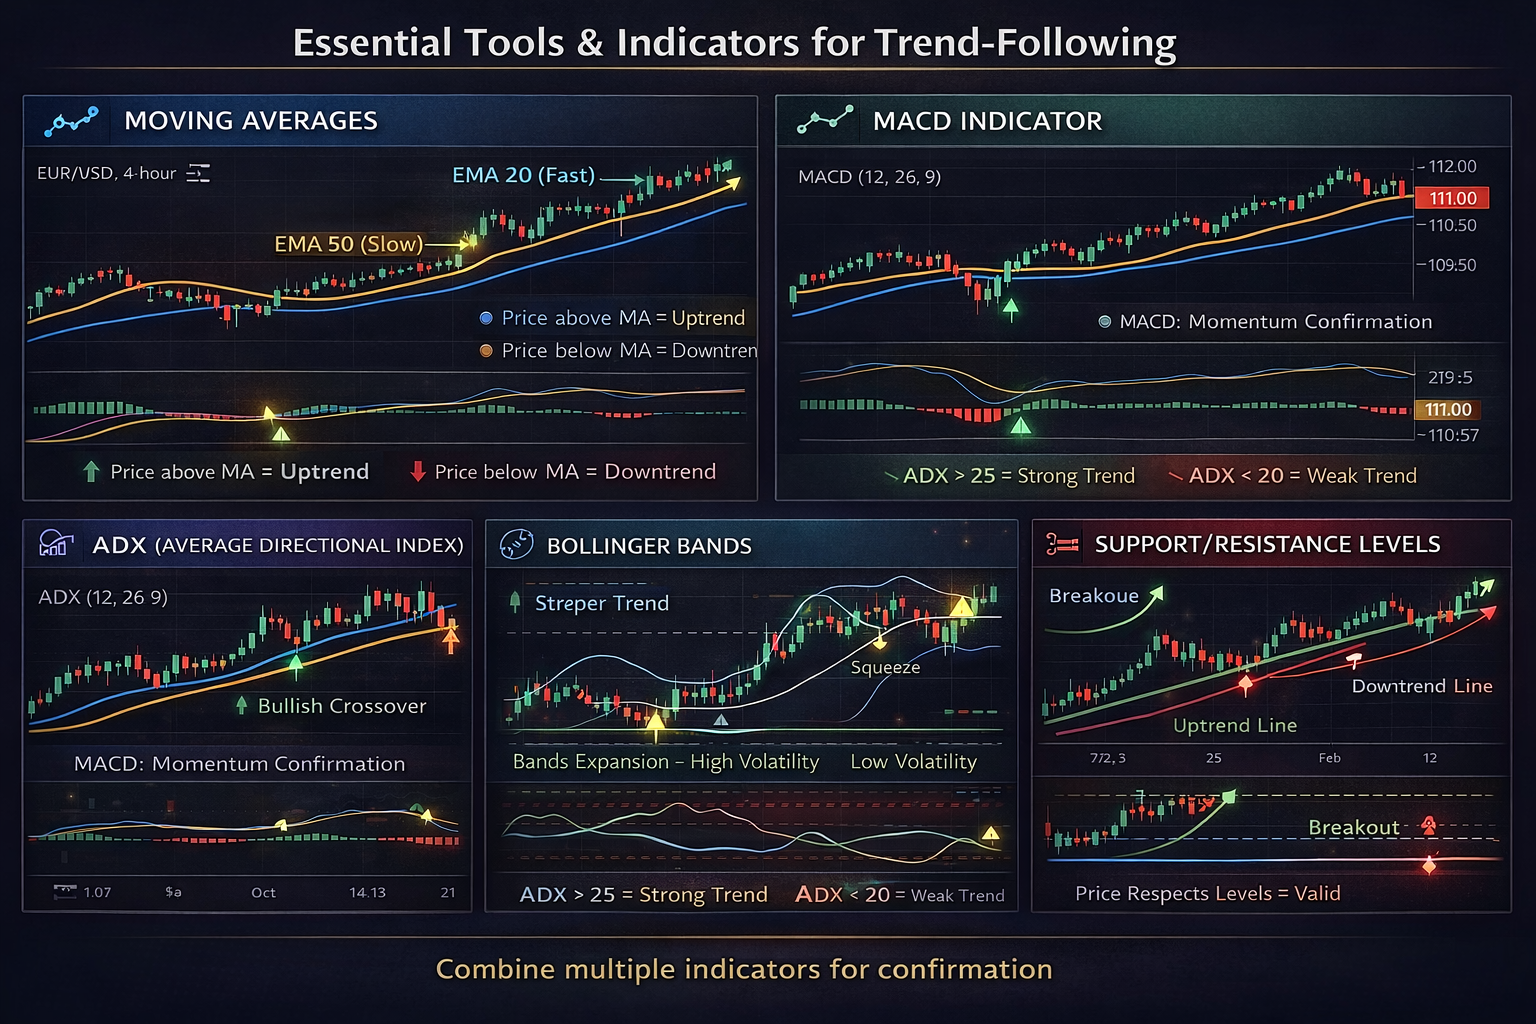
1. Moving Averages (EMA/SMA)
Moving averages are the foundation of trend following:
- 50 EMA: Short-term trend direction. Price above 50 EMA indicates uptrend, below indicates downtrend.
- 100 EMA: Medium-term trend confirmation. Provides stronger trend confirmation than 50 EMA.
- 200 EMA: Long-term trend filter. The most reliable trend indicator. Price above 200 EMA = major uptrend, below = major downtrend.
- EMA vs SMA: EMA reacts faster to price changes (better for trend following), while SMA is smoother but slower. Most trend followers prefer EMA.
2. MACD (Moving Average Convergence Divergence)
MACD is excellent for trend confirmation and momentum:
- MACD Line Crossover: When MACD line crosses above signal line = bullish signal. When it crosses below = bearish signal.
- Zero Line Crossover: MACD crossing above zero = strong bullish momentum. Crossing below zero = strong bearish momentum.
- Divergence: When price makes new highs but MACD doesn't (or vice versa), it signals potential trend weakening.
- Histogram: Shows momentum strength. Growing histogram = strengthening trend, shrinking = weakening trend.
3. ADX (Average Directional Index)
ADX measures trend strength, not direction:
- ADX > 25: Strong trend in place. Safe to use trend following strategies.
- ADX < 20: Weak or no trend. Avoid trend following, use range-bound strategies instead.
- ADX 20-25: Moderate trend. Proceed with caution, use tighter stops.
- Rising ADX: Trend is strengthening. Falling ADX = trend weakening.
4. Parabolic SAR
Parabolic SAR provides clear trend direction signals:
- SAR Below Price: Uptrend signal. Price is trending upward.
- SAR Above Price: Downtrend signal. Price is trending downward.
- SAR Flip: When SAR flips from below to above (or vice versa), it signals potential trend reversal.
- Stop Loss Placement: SAR can be used as a trailing stop loss, automatically adjusting as trend progresses.
5. Ichimoku Cloud
Ichimoku provides comprehensive trend analysis:
- Price Above Cloud: Strong uptrend. Price below cloud = strong downtrend.
- Cloud Color: Green cloud = bullish, red cloud = bearish.
- Tenkan/Kijun Cross: When Tenkan crosses above Kijun = bullish signal. Below = bearish signal.
- Chikou Span: When Chikou is above price = bullish confirmation. Below = bearish confirmation.
Recommended Indicator Combination:
- Primary: 50, 100, 200 EMA for trend direction and alignment
- Momentum: MACD for trend confirmation and momentum strength
- Trend Strength: ADX to filter out ranging markets (only trade when ADX > 25)
- Entry Timing: Parabolic SAR or Ichimoku for precise entry signals
Entry Signal Strategies
Effective entry signals are the foundation of profitable trend following. The best entries occur when multiple confirmations align, providing high-probability setups. Here are proven entry signal strategies used by professional trend followers.
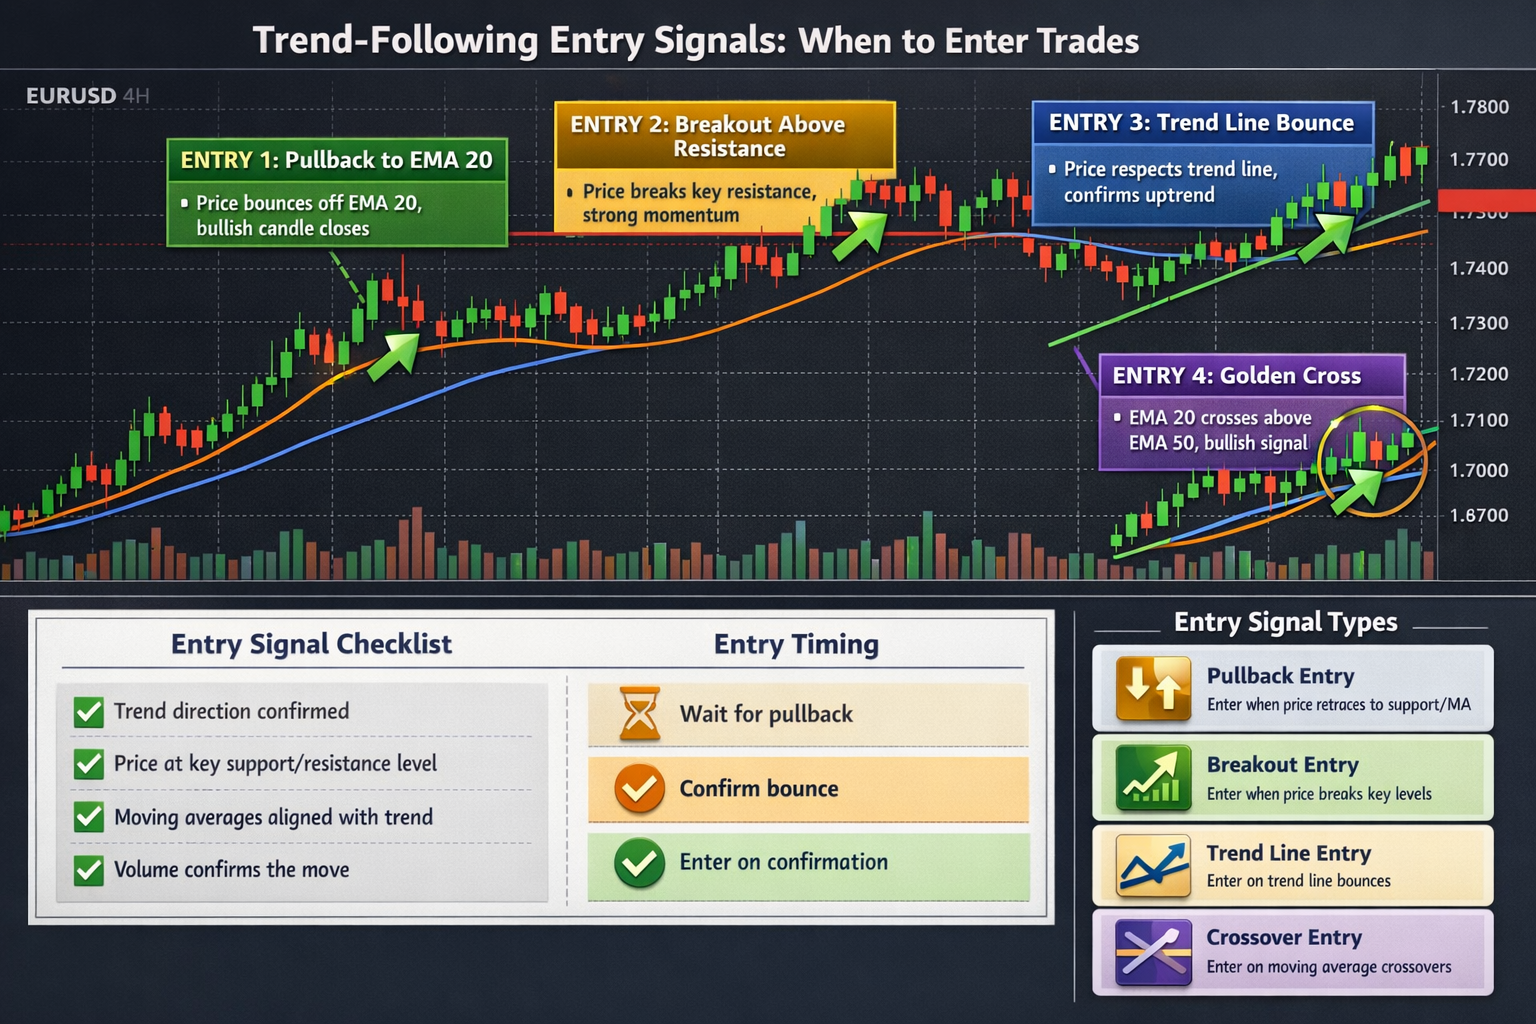
1. Pullback Entry Strategy
One of the most effective entry methods is buying pullbacks in uptrends or selling rallies in downtrends:
- Uptrend Pullback: Wait for price to pull back to a key moving average (50 or 100 EMA) or trend line support, then enter when price bounces and resumes upward movement.
- Downtrend Rally: Wait for price to rally to a key moving average or trend line resistance, then enter when price rejects and resumes downward movement.
- Advantages: Better entry prices, lower risk (tighter stops), higher risk-reward ratios, confirmation of trend continuation.
- Key Signals: Price touches support/resistance, bullish/bearish candlestick patterns, momentum indicators showing oversold/overbought conditions.
2. Breakout Entry Strategy
Entering on breakouts from consolidation patterns:
- Resistance Breakout: Enter long when price breaks above previous resistance with volume confirmation. Stop loss below the breakout level.
- Support Breakout: Enter short when price breaks below previous support with volume confirmation. Stop loss above the breakout level.
- Pattern Breakouts: Enter on breakouts from triangles, flags, pennants, or rectangles in the direction of the trend.
- Volume Confirmation: Always require increased volume on breakouts. Low-volume breakouts are often false signals.
3. Moving Average Crossover Entry
Entering when moving averages cross in trend direction:
- Golden Cross: Enter long when 50 EMA crosses above 200 EMA, confirming uptrend start.
- Death Cross: Enter short when 50 EMA crosses below 200 EMA, confirming downtrend start.
- Fast Cross: Use 20/50 EMA crossover for faster signals, but with more false signals.
- Confirmation: Wait for price to close above/below the crossover point and for momentum indicators to confirm.
4. Multiple Timeframe Entry
The strongest entries occur when multiple timeframes align:
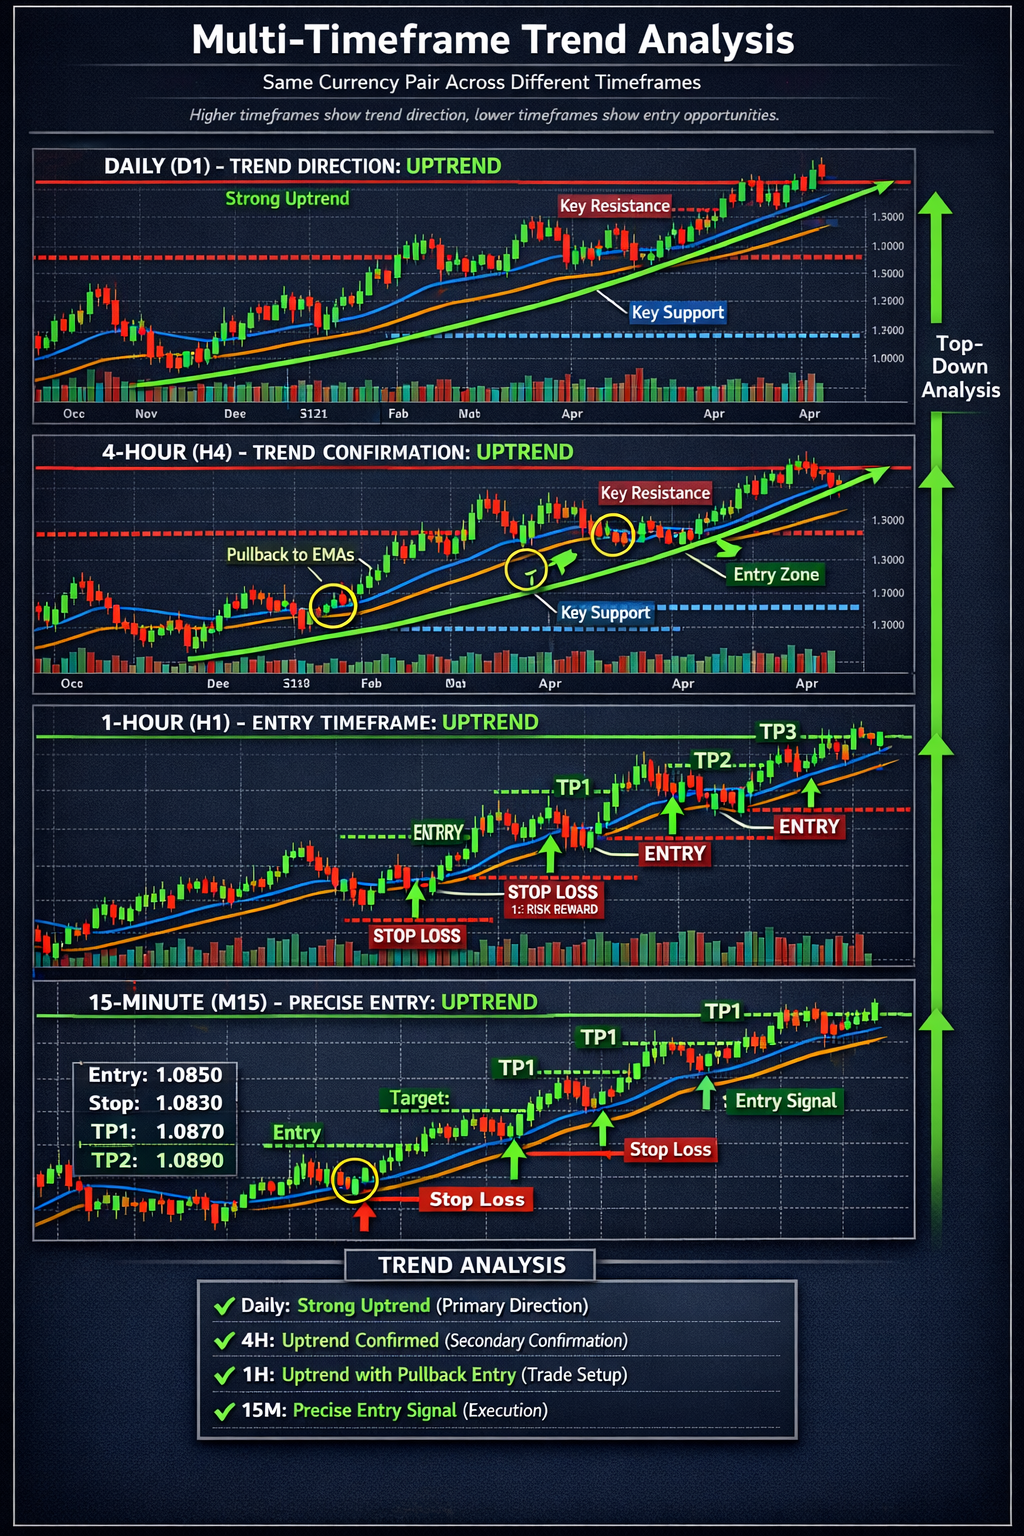
- Higher Timeframe Trend: Identify trend on daily or 4-hour chart (primary direction).
- Lower Timeframe Entry: Wait for entry signal on 1-hour or 4-hour chart in the direction of higher timeframe trend.
- Example: Daily chart shows uptrend → Wait for pullback on 4-hour → Enter on bullish reversal on 1-hour chart.
- Advantage: Higher probability trades with better risk-reward ratios.
Entry Signal Checklist:
- Higher timeframe trend is clearly established (daily/4-hour)
- ADX > 25 confirming trending market (not ranging)
- Entry signal on trading timeframe (pullback, breakout, or crossover)
- Momentum indicators confirming entry direction (MACD, RSI)
- Volume supporting the entry (increased volume on breakouts)
- Clear stop loss and take profit levels defined before entry
Exit Signal Strategies
Knowing when to exit is as important as knowing when to enter. Trend following requires patience to let winners run, but also discipline to exit when trends reverse. Here are proven exit strategies that protect profits while allowing trends to develop.
1. Trend Reversal Exit Signals
Exit when clear reversal signals appear:
- Moving Average Crossover: Exit long when 50 EMA crosses below 200 EMA. Exit short when 50 EMA crosses above 200 EMA.
- Trend Line Break: Exit when price breaks through the trend line in the opposite direction of your trade.
- Support/Resistance Break: Exit long when price breaks below key support. Exit short when price breaks above key resistance.
- Momentum Divergence: Exit when price makes new highs/lows but momentum indicators don't confirm (divergence).
2. Trailing Stop Loss Strategy
Use trailing stops to protect profits while allowing trends to continue:
- ATR-Based Trailing Stop: Set stop loss at 2x ATR below/above current price. Adjust as price moves in your favor.
- Percentage Trailing Stop: Trail stop at fixed percentage (e.g., 3-5%) below highest price for longs, above lowest for shorts.
- Moving Average Trailing Stop: Use 20 or 50 EMA as trailing stop. Exit when price closes below/above the EMA.
- Parabolic SAR: Use SAR as automatic trailing stop. When SAR flips, exit the trade.
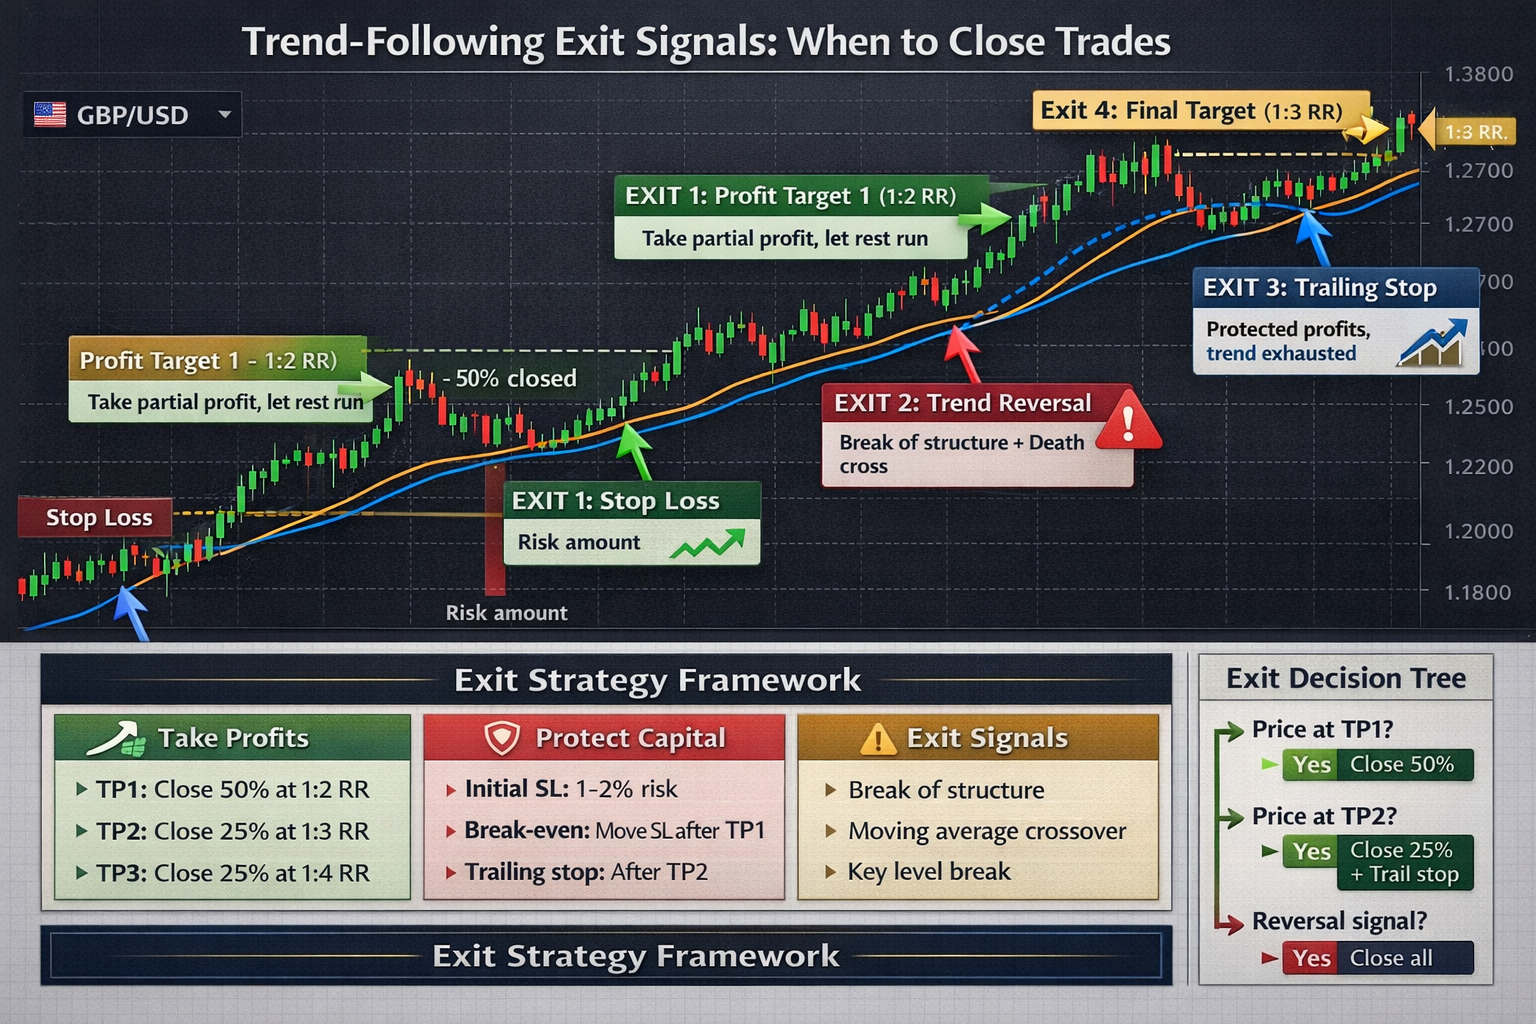
3. Profit Target Exits
Take partial or full profits at predetermined levels:
- Risk-Reward Targets: Take 50% profit at 2:1 risk-reward, let remaining 50% run to 3:1 or 5:1.
- Support/Resistance Targets: Take profits at major support/resistance levels where price may reverse.
- Fibonacci Targets: Take profits at Fibonacci extension levels (1.272, 1.618, 2.0).
- Partial Profit Strategy: Close 30-50% at first target, trail stop on remaining position to capture larger moves.
4. Time-Based Exits
Exit trades that don't develop as expected:
- Maximum Hold Period: Exit if trade doesn't reach first profit target within X days/weeks (e.g., 2 weeks for daily timeframe).
- Stagnation Exit: Exit if price consolidates for extended period without trend continuation.
- End of Trend Period: Exit before major news events or market closures that may reverse trends.
Exit Signal Checklist:
- Trend reversal signals appear (moving average crossover, trend line break)
- Momentum divergence indicating trend weakening
- Price reaches predetermined profit targets
- Trailing stop loss is hit (protecting profits)
- ADX drops below 20 (trend weakening, market becoming range-bound)
Risk Management in Trend Following
Effective risk management is what separates profitable trend followers from those who blow up their accounts. Trend following requires wider stops, making proper risk management absolutely critical. Here's how to protect your capital while allowing trends to develop.
1. Position Sizing
Proper position sizing is the foundation of risk management:
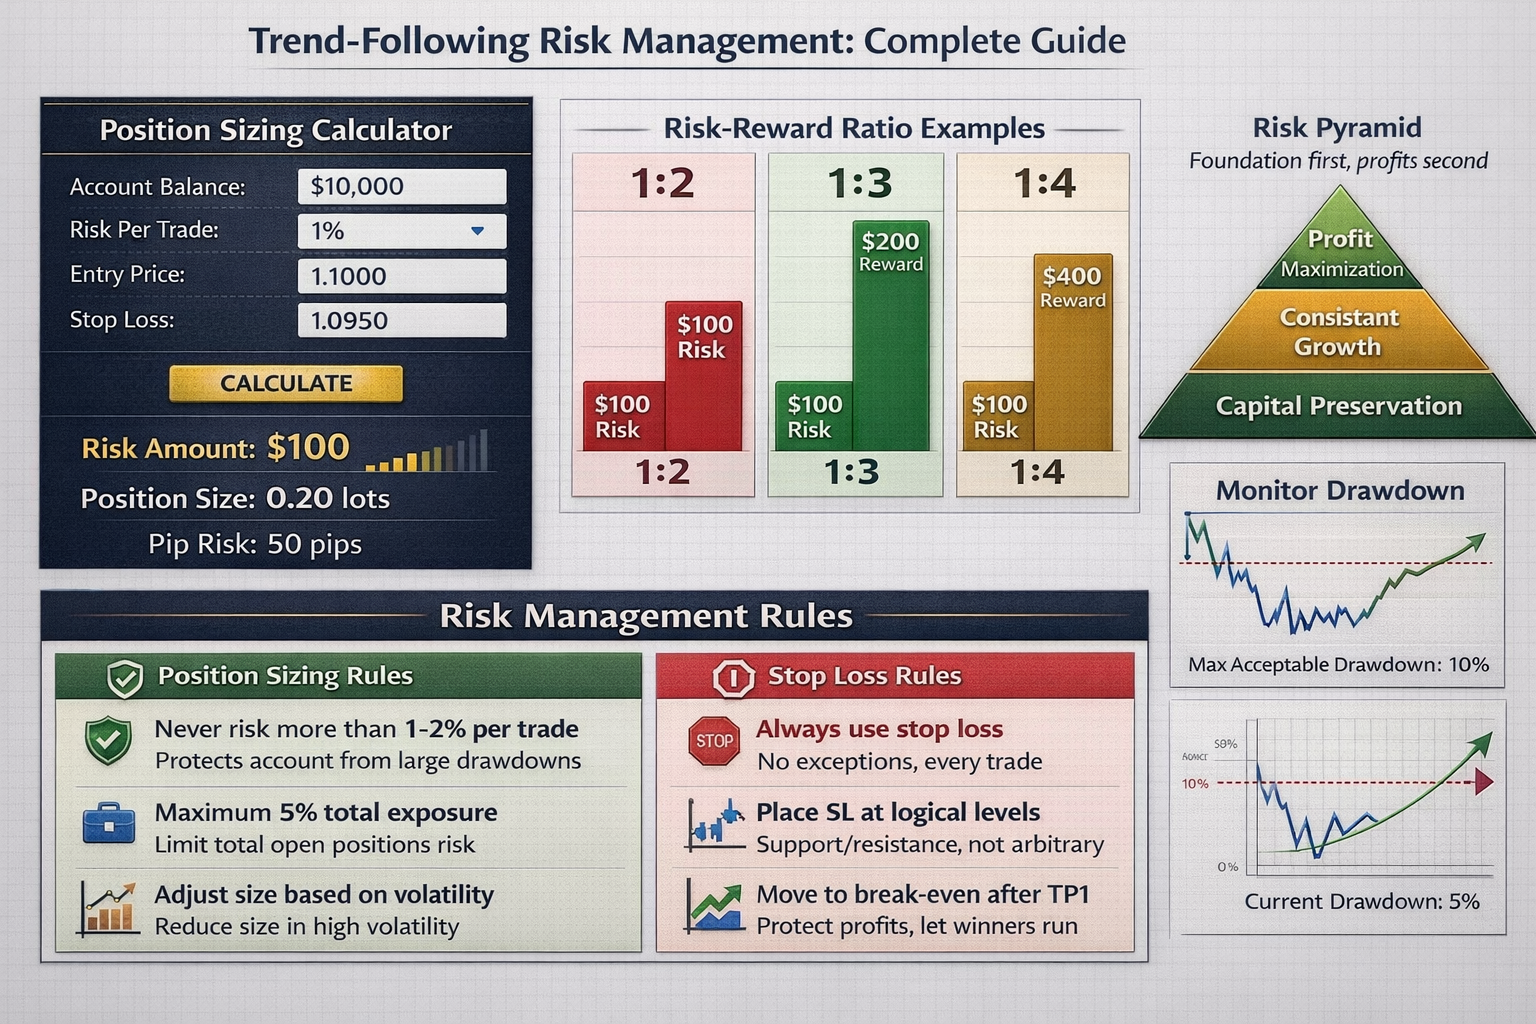
- Fixed Risk Per Trade: Risk 1-2% of account balance per trade. Never risk more than 2% on a single trade.
- Calculate Position Size: Position size = (Account Balance × Risk %) / (Entry Price - Stop Loss Price). This ensures you always risk the same percentage regardless of stop loss distance.
- Account for Spread: Include spread in your risk calculation. If spread is 2 pips and stop is 50 pips, total risk is 52 pips.
- Maximum Daily Risk: Limit total risk exposure to 5-6% per day. If you hit this limit, stop trading for the day.
2. Stop Loss Placement
Stop losses must be wide enough to avoid normal volatility but tight enough to limit losses:
- ATR-Based Stops: Use 2-3x ATR for stop loss distance. This adapts to market volatility automatically.
- Support/Resistance Stops: Place stops just beyond key support (for longs) or resistance (for shorts) levels.
- Moving Average Stops: Place stops below/above key moving averages (50 or 100 EMA).
- Never Move Stops Against You: Once set, only move stops in your favor (trailing stops). Never widen stops to avoid losses.
3. Risk-Reward Ratios
Trend following requires high risk-reward ratios to be profitable:
- Minimum 1:2 Ratio: Always aim for at least 2:1 risk-reward. Risk 50 pips to make 100+ pips.
- Ideal 1:3 to 1:5: Best trend following trades offer 3:1 to 5:1 risk-reward ratios.
- Let Winners Run: Don't exit at 1:1 if trend is strong. Use trailing stops to capture larger moves.
- Partial Profits: Take 50% profit at 2:1, let remaining 50% run to 3:1 or 5:1 with trailing stop.
4. Drawdown Management
Protect your account from extended drawdowns:
- Maximum Drawdown Limit: Stop trading if account drops 10-15% from peak. Take a break, review strategy, and resume with smaller position sizes.
- Correlation Risk: Don't trade multiple highly correlated pairs simultaneously. Diversify across different currency pairs.
- Market Condition Filters: Reduce position sizes or stop trading when ADX < 20 (ranging markets).
- Emotional Control: Never revenge trade after losses. Stick to your risk management rules regardless of emotions.
Risk Management Rules:
- Risk maximum 1-2% per trade, never more
- Always use stop losses, placed before entering trade
- Aim for minimum 1:2 risk-reward, ideally 1:3 to 1:5
- Limit daily risk to 5-6% maximum
- Stop trading if account drawdown exceeds 10-15%
- Never move stops against you, only trail stops in your favor
Best Timeframes for Trend Following
Choosing the right timeframe is crucial for trend following success. Different timeframes offer different trade-offs between signal reliability and trading frequency. Understanding which timeframes work best helps you align your strategy with your trading goals and lifestyle.
1. Daily Timeframe (Recommended for Most Traders)
Daily charts are ideal for trend following:
- Reliability: Daily trends are most reliable, with less noise and fewer false signals than lower timeframes.
- Time Commitment: Requires only 15-30 minutes daily to check charts and manage trades. Perfect for part-time traders.
- Trade Frequency: Generates 2-5 high-quality signals per month per currency pair. Less frequent but higher quality.
- Holding Period: Trades typically last 1-4 weeks, allowing trends to develop fully.
- Stop Loss: Wider stops (100-200+ pips) require more capital but allow trends room to breathe.
- Best For: Swing traders, part-time traders, those seeking high-probability setups with minimal time commitment.
2. 4-Hour Timeframe
Balance between reliability and frequency:
- Reliability: Good trend reliability with moderate noise. Requires daily trend confirmation.
- Time Commitment: Requires 1-2 hours daily to monitor and manage trades.
- Trade Frequency: Generates 5-10 signals per month. More frequent than daily but still high quality.
- Holding Period: Trades typically last 3-7 days.
- Stop Loss: Medium stops (50-100 pips) suitable for moderate capital accounts.
- Best For: Day traders who can monitor markets during trading hours, those seeking more trading opportunities.
3. 1-Hour Timeframe
More active trading with higher frequency:
- Reliability: Lower reliability than higher timeframes. Requires strong 4-hour and daily trend confirmation.
- Time Commitment: Requires 3-4 hours daily for active monitoring.
- Trade Frequency: Generates 10-20 signals per month. Higher frequency but more false signals.
- Holding Period: Trades typically last 1-3 days.
- Stop Loss: Tighter stops (30-50 pips) suitable for smaller accounts but more prone to stop-outs.
- Best For: Active day traders, those with time to monitor markets, traders seeking more frequent opportunities.
4. Weekly Timeframe
Longest-term trend following:
- Reliability: Highest reliability, capturing major multi-month trends.
- Time Commitment: Minimal - check charts weekly, manage trades monthly.
- Trade Frequency: Very low - 1-3 signals per year per pair. Extremely selective.
- Holding Period: Trades can last months to years.
- Stop Loss: Very wide stops (200-500+ pips) require significant capital.
- Best For: Position traders, those with large capital, investors seeking long-term trends.
Timeframe Selection Guide:
- Part-time traders: Use daily or weekly timeframes (15-30 min daily commitment)
- Full-time traders: Use 4-hour or daily timeframes (1-2 hours daily commitment)
- Active day traders: Use 1-hour timeframe with 4-hour/daily confirmation (3-4 hours daily)
- Always confirm: Lower timeframe trends with higher timeframe direction
Common Mistakes to Avoid
Many traders fail at trend following not because the strategy doesn't work, but because they make avoidable mistakes. Learning from these common errors helps you avoid costly losses and improve your trading performance.
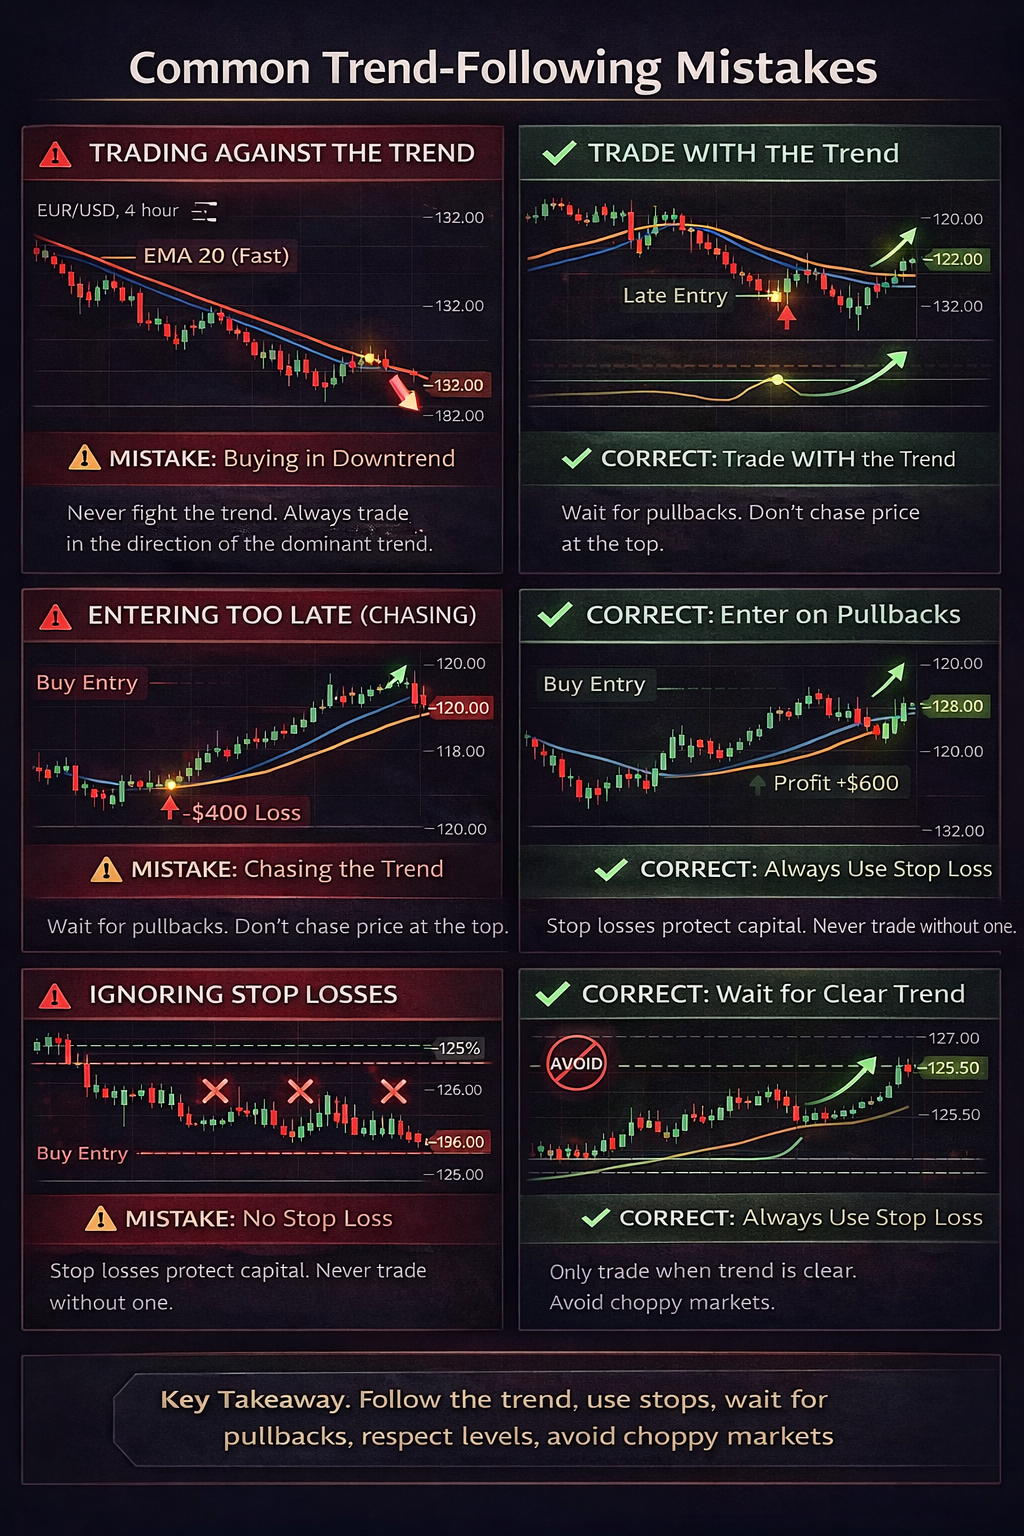
1. Exiting Trades Too Early
The most common mistake is cutting profits short:
- Problem: Taking profits at 1:1 or 1:1.5 when trend continues to 1:3 or 1:5, leaving significant profits on the table.
- Solution: Use trailing stops instead of fixed profit targets. Let winners run until trend reversal signals appear.
- Mindset: Accept that you'll never catch the exact top/bottom. Focus on capturing the middle 60-80% of trends.
2. Trading Against Higher Timeframe Trends
Fighting the trend is a recipe for losses:
- Problem: Taking counter-trend trades on lower timeframes when higher timeframe shows opposite trend.
- Solution: Always check higher timeframe first. Only trade in the direction of higher timeframe trend.
- Rule: Daily trend > 4-hour trend > 1-hour trend. Never fight the higher timeframe.
3. Using Stops That Are Too Tight
Tight stops get stopped out by normal volatility:
- Problem: Using 20-30 pip stops on daily timeframe trades, getting stopped out by normal market noise.
- Solution: Use ATR-based stops (2-3x ATR) or support/resistance-based stops that account for volatility.
- Adjustment: If stops are too wide for your account, trade on lower timeframes or reduce position size.
4. Trading in Ranging Markets
Trend following fails in sideways markets:
- Problem: Using trend following signals when market is ranging, leading to whipsaws and losses.
- Solution: Use ADX to filter. Only trade when ADX > 25. When ADX < 20, avoid trend following or use range-bound strategies.
- Identification: Ranging markets show price bouncing between horizontal support and resistance without clear direction.
5. Ignoring Multiple Timeframe Analysis
Single timeframe analysis is incomplete:
- Problem: Making trading decisions based only on one timeframe, missing the bigger picture.
- Solution: Always analyze 3 timeframes: higher (trend direction), current (entry timing), lower (precise entry).
- Workflow: Start with daily → confirm 4-hour → enter on 1-hour signals in trend direction.
6. Overtrading
Taking every signal leads to poor performance:
- Problem: Entering trades on every signal instead of waiting for high-probability setups with multiple confirmations.
- Solution: Be selective. Only trade when 3+ indicators confirm, higher timeframe aligns, and ADX shows trending market.
- Quality over Quantity: 5 high-quality trades per month beat 20 mediocre trades.
Mistake Prevention Checklist:
- Always check higher timeframe trend before entering any trade
- Use ADX to confirm trending market (ADX > 25) before trading
- Set stops based on ATR or support/resistance, not arbitrary pip amounts
- Use trailing stops instead of fixed profit targets to let winners run
- Wait for multiple confirmations before entering trades (don't overtrade)
Advanced Trend Following Techniques
Once you've mastered the basics, these advanced techniques can significantly improve your trend following performance. These methods are used by professional traders and institutional systems to enhance profitability and reduce risk.
1. Multi-Timeframe Confirmation System
Use a systematic approach across multiple timeframes:
- Trend Filter (Daily): Identify primary trend direction. Only trade in this direction.
- Entry Timing (4-Hour): Wait for pullback or consolidation on 4-hour chart.
- Precise Entry (1-Hour): Enter on bullish/bearish reversal patterns or breakouts on 1-hour.
- Exit Management (All Timeframes): Monitor all timeframes for reversal signals. Exit when higher timeframe shows reversal.
2. Dynamic Position Sizing
Adjust position sizes based on trend strength and market conditions:
- ADX-Based Sizing: Increase position size when ADX > 30 (strong trend), reduce when ADX 25-30 (moderate trend).
- Volatility-Based Sizing: Reduce position size during high volatility periods, increase during stable trends.
- Account Growth Sizing: Increase position sizes as account grows, but maintain 1-2% risk per trade.
- Correlation Adjustment: Reduce position sizes when trading multiple correlated pairs simultaneously.
3. Trend Strength Scoring System
Score trends to identify highest-probability setups:
- Price Action (2 points): Higher highs/higher lows (uptrend) or lower highs/lower lows (downtrend).
- Moving Averages (2 points): Price above/below key EMAs with proper alignment.
- Momentum (1 point): MACD and RSI confirming trend direction.
- Volume (1 point): Volume supporting trend direction.
- ADX (1 point): ADX > 25 indicating strong trend.
- Trade Only High Scores: Only enter trades scoring 5+ out of 7 points.
4. Portfolio Diversification
Spread risk across multiple currency pairs and timeframes:
- Currency Pair Diversification: Trade 3-5 different pairs to avoid overexposure to single currency movements.
- Timeframe Diversification: Run strategies on multiple timeframes (daily + 4-hour) for different trade frequencies.
- Correlation Management: Avoid trading highly correlated pairs simultaneously (e.g., EUR/USD and GBP/USD).
- Geographic Diversification: Include pairs from different geographic regions (major, minor, exotic).
5. Adaptive Trend Following
Adjust strategy based on market regime:
- Trending Markets (ADX > 25): Use standard trend following with wider stops and larger targets.
- Ranging Markets (ADX < 20): Stop trend following, switch to range-bound strategies or stay out of market.
- Volatile Markets: Reduce position sizes, widen stops, use longer timeframes.
- Low Volatility: Increase position sizes slightly, use tighter stops, focus on breakouts.
Using SignalWavesAI for Trend Following
SignalWavesAI provides professional-grade trading signals that can enhance your trend following strategy. When used correctly, these signals can improve entry timing, confirm trend direction, and help you avoid false signals. Here's how to integrate SignalWavesAI signals effectively into your trend following framework.
1. Signal Confirmation Framework
Use SignalWavesAI signals as confirmation, not as sole entry criteria:
- Step 1 - Identify Trend: First, identify trend direction using your own analysis (moving averages, price action, higher timeframes).
- Step 2 - Wait for Signal: Wait for SignalWavesAI to generate a signal in the direction of your identified trend.
- Step 3 - Confirm Alignment: Ensure SignalWavesAI signal aligns with higher timeframe trend and your analysis.
- Step 4 - Enter Trade: Enter when SignalWavesAI signal confirms your trend following setup.
- Step 5 - Manage Risk: Use your own risk management rules (stop loss, position sizing) regardless of signal recommendations.
2. Multi-Timeframe Signal Analysis
Combine signals across multiple timeframes:
- Higher Timeframe Signals: Use daily or 4-hour signals to confirm overall trend direction.
- Lower Timeframe Signals: Use 1-hour or 4-hour signals for precise entry timing.
- Signal Alignment: Only trade when signals align across timeframes. Daily bullish + 4-hour bullish + 1-hour bullish = very strong setup.
- Signal Divergence: If signals conflict across timeframes, wait for alignment or avoid the trade.
3. Signal Quality Assessment
Evaluate signal quality before trading:
- Signal Strength: Strong signals with multiple indicator confirmations are more reliable than weak signals.
- Market Conditions: Signals in trending markets (ADX > 25) are more reliable than signals in ranging markets.
- Higher Timeframe Alignment: Signals aligned with higher timeframe trends are significantly more reliable.
- Volume Confirmation: Signals accompanied by increased volume are more trustworthy.
- Recent Performance: Consider recent signal accuracy. If signals have been accurate recently, they may be more reliable.
4. Risk Management Integration
Maintain your risk management regardless of signals:
- Position Sizing: Always risk 1-2% per trade, regardless of signal strength or recommendations.
- Stop Loss Placement: Use your own stop loss calculations (ATR-based, support/resistance) rather than blindly following signal stops.
- Take Profit Strategy: Use trailing stops to let winners run, don't exit at signal's first target if trend continues.
- Daily Risk Limits: Maintain your daily risk limits even if multiple signals appear.
SignalWavesAI Integration Best Practices:
- Use signals as confirmation tool, not as sole trading decision
- Always verify signals align with higher timeframe trends
- Combine signals with your own trend analysis for stronger confirmation
- Maintain your risk management rules regardless of signal recommendations
- Track signal performance to identify which signals work best for your style
Real Case Studies and Examples
Learning from real examples helps you understand how trend following works in practice. These case studies illustrate successful trend following trades, common patterns, and lessons learned from actual market scenarios.
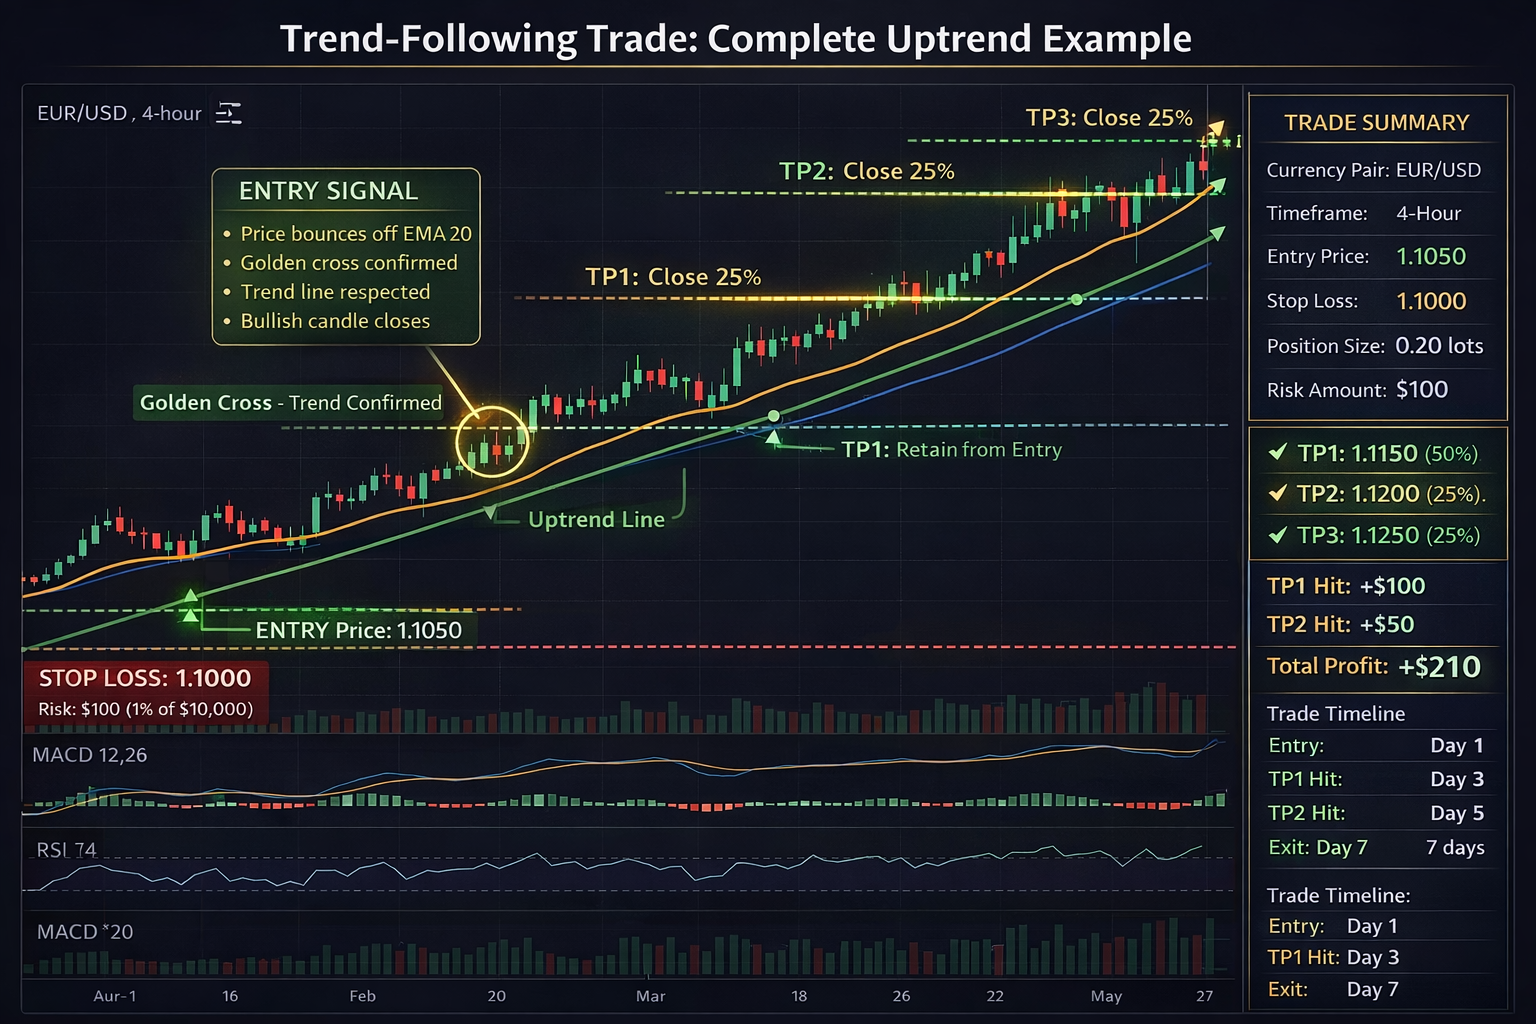
Case Study 1: EUR/USD Daily Uptrend
Setup: EUR/USD daily chart showing clear uptrend with price making higher highs and higher lows. 50 EMA crossed above 200 EMA (golden cross). ADX at 28 indicating strong trend.
- Entry: Entered long on pullback to 100 EMA support at 1.0850 after bullish reversal candlestick pattern.
- Stop Loss: Placed at 1.0800 (50 pips below entry, 2x ATR).
- Take Profit: Initial target 1.1000 (150 pips, 3:1 risk-reward). Took 50% profit at target, trailed stop on remaining 50%.
- Result: Trade reached 1.1050 before trailing stop was hit. Total profit: 175 pips (3.5:1 risk-reward). Held for 3 weeks.
- Key Lesson: Patience to wait for pullback entry provided better risk-reward than entering on breakout. Trailing stop captured additional profits.
Case Study 2: GBP/USD 4-Hour Downtrend
Setup: Daily chart showed downtrend. 4-hour chart showed price breaking below key support at 1.2650 with increased volume. MACD showing bearish momentum. ADX at 32.
- Entry: Entered short on retest of broken support (now resistance) at 1.2640 after bearish rejection.
- Stop Loss: Placed at 1.2690 (50 pips above entry).
- Take Profit: Target at 1.2490 (150 pips, 3:1 ratio).
- Result: Price reached target in 5 days. Profit: 150 pips (3:1 risk-reward).
- Key Lesson: Trading in direction of higher timeframe (daily downtrend) provided high-probability setup. Retest entry provided better price than breakout entry.
Case Study 3: Failed Trade - Ranging Market
Setup: USD/JPY showed what appeared to be uptrend on 4-hour chart. Moving averages aligned bullishly. However, ADX was only 18, indicating ranging market.
- Entry: Entered long on breakout above resistance at 150.50.
- Stop Loss: Placed at 150.20 (30 pips).
- Result: Price immediately reversed, hitting stop loss. Loss: 30 pips.
- Key Lesson: Ignoring ADX filter led to false breakout trade. Should have waited for ADX > 25 before trading. Always check market condition (trending vs ranging) before entering trades.
Key Takeaways from Case Studies:
- Always check ADX before trading - avoid ranging markets (ADX < 20)
- Pullback entries provide better risk-reward than breakout entries
- Higher timeframe trend alignment is crucial for success
- Trailing stops capture additional profits when trends extend
- Not every trade will be profitable - focus on overall expectancy, not individual trades
Conclusion: Mastering Trend Following Signals
Trend following signal strategy is one of the most time-tested and profitable approaches to forex trading. By identifying strong trends, using effective signals for entry and exit, and managing risk properly, you can achieve consistent profitability over the long term.
The key to success lies in patience, discipline, and systematic execution. Trend following requires accepting lower win rates (40-50%) but compensates with high risk-reward ratios (1:2 to 1:5). The strategy works because trends persist, and by following them systematically, you can capture significant moves while cutting losses quickly.
Key Success Factors:
- Always trade with the trend: Never fight higher timeframe trends. The trend is your friend until it ends.
- Use multiple confirmations: Combine price action, moving averages, momentum indicators, and volume for strongest signals.
- Manage risk strictly: Risk 1-2% per trade, use proper stop losses, aim for 1:2 to 1:5 risk-reward ratios.
- Filter market conditions: Only trade when ADX > 25 (trending markets). Avoid ranging markets.
- Let winners run: Use trailing stops instead of fixed profit targets. Most profits come from a few large winning trades.
- Be patient and selective: Wait for high-probability setups. Quality over quantity in trend following.
Remember, trend following is not about predicting the future—it's about identifying and following established trends until they reverse. Success comes from systematic execution, proper risk management, and the discipline to stick to your rules even when trades don't work out as expected.
Start by practicing on demo accounts, master the identification of trends and signals, develop your risk management framework, and gradually transition to live trading with small position sizes. With patience, discipline, and continuous learning, trend following signal strategy can become a powerful tool in your trading arsenal.
Related Articles
Put This Knowledge Into Action
Explore SignalWavesAI tools and start applying what you've learned with professional forex signals.